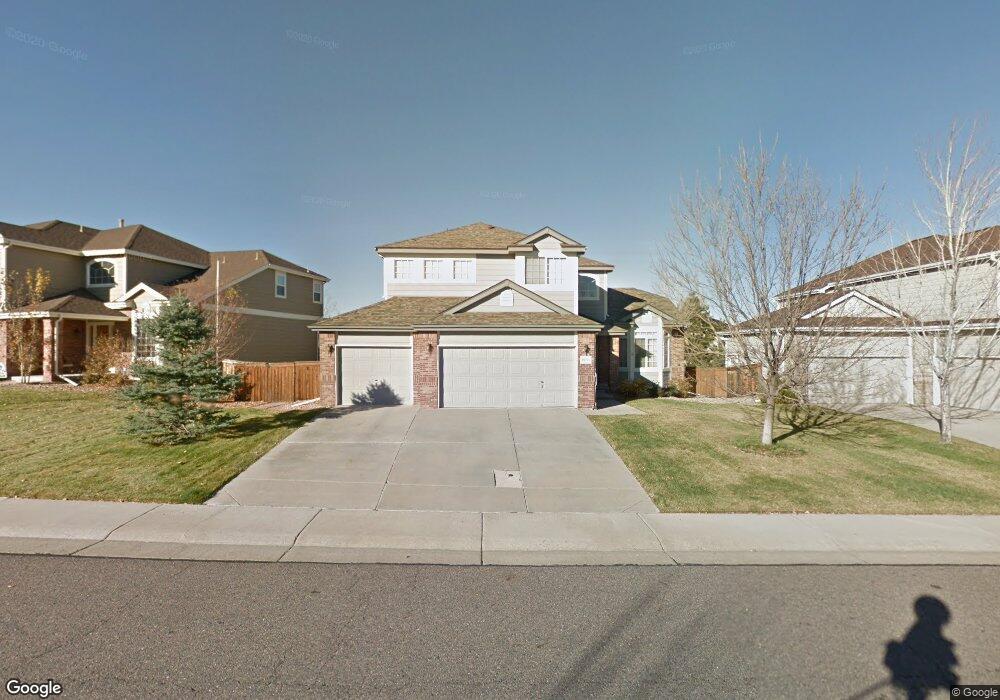
10262 Knoll Cir Highlands Ranch, CO 80130
Southridge NeighborhoodEstimated Value: $865,000 - $942,000
5
Beds
3
Baths
4,293
Sq Ft
$207/Sq Ft
Est. Value
About This Home
This home is located at 10262 Knoll Cir, Highlands Ranch, CO 80130 and is currently estimated at $889,098, approximately $207 per square foot. 10262 Knoll Cir is a home located in Douglas County with nearby schools including Redstone Elementary School, Rocky Heights Middle School, and Rock Canyon High School.
Ownership History
Date
Name
Owned For
Owner Type
Purchase Details
Closed on
Jan 10, 2011
Sold by
Jacobson Mark F and Jacobson Cynthia D
Bought by
Lu Yang and Wang Hui
Current Estimated Value
Home Financials for this Owner
Home Financials are based on the most recent Mortgage that was taken out on this home.
Original Mortgage
$335,000
Outstanding Balance
$10,116
Interest Rate
4.44%
Mortgage Type
New Conventional
Estimated Equity
$878,982
Purchase Details
Closed on
Feb 10, 1999
Sold by
Richmond American Homes Of Colorado Inc
Bought by
Jacobson Mark F and Jacobson Cynthia D
Home Financials for this Owner
Home Financials are based on the most recent Mortgage that was taken out on this home.
Original Mortgage
$214,900
Interest Rate
6.78%
Purchase Details
Closed on
Dec 12, 1997
Sold by
Shea Homes
Bought by
Richmond American Homes Colo Inc
Purchase Details
Closed on
Oct 1, 1997
Sold by
Mission Viejo Co
Bought by
Shea Homes
Create a Home Valuation Report for This Property
The Home Valuation Report is an in-depth analysis detailing your home's value as well as a comparison with similar homes in the area
Home Values in the Area
Average Home Value in this Area
Purchase History
| Date | Buyer | Sale Price | Title Company |
|---|---|---|---|
| Lu Yang | $355,000 | None Available | |
| Jacobson Mark F | $268,638 | Land Title | |
| Richmond American Homes Colo Inc | $391,800 | -- | |
| Shea Homes | -- | -- |
Source: Public Records
Mortgage History
| Date | Status | Borrower | Loan Amount |
|---|---|---|---|
| Open | Lu Yang | $335,000 | |
| Previous Owner | Jacobson Mark F | $214,900 |
Source: Public Records
Tax History Compared to Growth
Tax History
| Year | Tax Paid | Tax Assessment Tax Assessment Total Assessment is a certain percentage of the fair market value that is determined by local assessors to be the total taxable value of land and additions on the property. | Land | Improvement |
|---|---|---|---|---|
| 2024 | $5,218 | $59,040 | $12,640 | $46,400 |
| 2023 | $5,208 | $59,040 | $12,640 | $46,400 |
| 2022 | $3,913 | $42,830 | $9,200 | $33,630 |
| 2021 | $4,070 | $42,830 | $9,200 | $33,630 |
| 2020 | $3,769 | $40,640 | $8,420 | $32,220 |
| 2019 | $3,783 | $40,640 | $8,420 | $32,220 |
| 2018 | $3,658 | $38,710 | $8,080 | $30,630 |
| 2017 | $3,331 | $38,710 | $8,080 | $30,630 |
| 2016 | $3,284 | $37,450 | $7,890 | $29,560 |
| 2015 | $3,354 | $37,450 | $7,890 | $29,560 |
| 2014 | $3,062 | $31,570 | $7,320 | $24,250 |
Source: Public Records
Map
Nearby Homes
- 5632 Tory Pointe
- 10278 Dan Ct
- 10292 Nickolas Ave
- 10439 Cheetah Winds
- 10445 Cheetah Winds
- 10296 Lauren Ct
- 5639 Jaguar Way
- 10078 Apollo Bay Way
- 10557 Jaguar Dr
- 10330 Lions Path
- 10375 Lions Heart
- 4967 Waldenwood Dr
- 10497 Wagon Box Cir
- 4931 Waldenwood Dr
- 4907 Fenwood Dr
- 10541 Jaguar Glen
- 4848 Fenwood Dr
- 10645 Cedarcrest Cir
- 10557 Eby Cir
- 10360 Tracewood Ct
- 10256 Knoll Cir
- 10270 Knoll Cir
- 10178 Stephen Place
- 10250 Knoll Cir
- 10276 Knoll Cir
- 10168 Stephen Place
- 10269 Knoll Cir
- 10259 Knoll Cir
- 10273 Knoll Cir
- 10158 Stephen Place
- 10253 Knoll Cir
- 10244 Knoll Cir
- 10284 Knoll Cir
- 5631 Tory Pointe
- 10281 Knoll Cir
- 10148 Stephen Place
- 10249 Dan Ct
- 10257 Dan Ct
- 10243 Dan Ct
- 10238 Knoll Cir