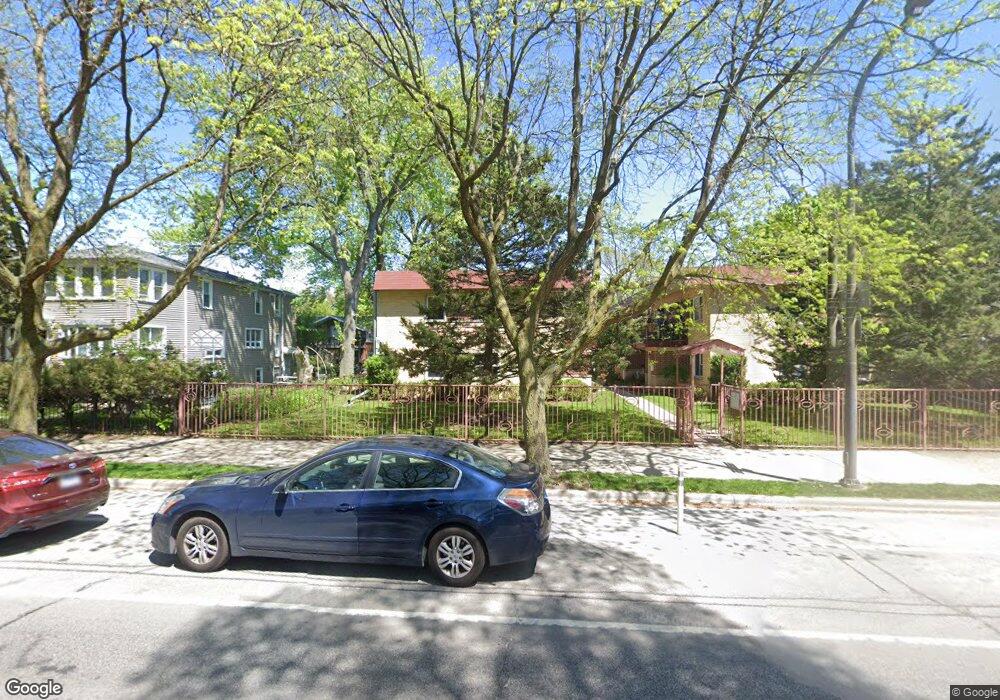
1027 Dodge Ave Unit 1027C Evanston, IL 60202
Crown Park NeighborhoodEstimated Value: $342,000 - $421,000
3
Beds
--
Bath
1,100
Sq Ft
$332/Sq Ft
Est. Value
About This Home
This home is located at 1027 Dodge Ave Unit 1027C, Evanston, IL 60202 and is currently estimated at $365,012, approximately $331 per square foot. 1027 Dodge Ave Unit 1027C is a home located in Cook County with nearby schools including Nichols Middle School, Evanston Township High School, and Pope John XXIII School.
Ownership History
Date
Name
Owned For
Owner Type
Purchase Details
Closed on
Aug 18, 2020
Sold by
Davis Andre E and Willis Jennifer
Bought by
Debose Deion and Debose Kimberly
Current Estimated Value
Home Financials for this Owner
Home Financials are based on the most recent Mortgage that was taken out on this home.
Original Mortgage
$252,200
Interest Rate
3.37%
Mortgage Type
New Conventional
Purchase Details
Closed on
Jul 14, 2006
Sold by
1021 Thc Llc
Bought by
Davis Andre E and Willis Jennifer
Home Financials for this Owner
Home Financials are based on the most recent Mortgage that was taken out on this home.
Original Mortgage
$244,000
Interest Rate
6.82%
Mortgage Type
Unknown
Create a Home Valuation Report for This Property
The Home Valuation Report is an in-depth analysis detailing your home's value as well as a comparison with similar homes in the area
Home Values in the Area
Average Home Value in this Area
Purchase History
| Date | Buyer | Sale Price | Title Company |
|---|---|---|---|
| Debose Deion | $260,000 | Greater Illinois Title Co | |
| Davis Andre E | $305,000 | Cti |
Source: Public Records
Mortgage History
| Date | Status | Borrower | Loan Amount |
|---|---|---|---|
| Previous Owner | Debose Deion | $252,200 | |
| Previous Owner | Davis Andre E | $244,000 |
Source: Public Records
Tax History Compared to Growth
Tax History
| Year | Tax Paid | Tax Assessment Tax Assessment Total Assessment is a certain percentage of the fair market value that is determined by local assessors to be the total taxable value of land and additions on the property. | Land | Improvement |
|---|---|---|---|---|
| 2024 | $6,343 | $25,860 | $3,608 | $22,252 |
| 2023 | $6,085 | $25,860 | $3,608 | $22,252 |
| 2022 | $6,085 | $25,860 | $3,608 | $22,252 |
| 2021 | $5,669 | $21,077 | $2,405 | $18,672 |
| 2020 | $4,768 | $21,077 | $2,405 | $18,672 |
| 2019 | $4,755 | $23,463 | $2,405 | $21,058 |
| 2018 | $5,205 | $22,183 | $2,004 | $20,179 |
| 2017 | $5,084 | $22,183 | $2,004 | $20,179 |
| 2016 | $5,046 | $22,183 | $2,004 | $20,179 |
| 2015 | $5,640 | $23,361 | $1,653 | $21,708 |
| 2014 | $5,600 | $23,361 | $1,653 | $21,708 |
| 2013 | $5,455 | $23,361 | $1,653 | $21,708 |
Source: Public Records
Map
Nearby Homes
- 1133 Dodge Ave
- 1216 Darrow Ave
- 1810 Washington St
- 1610 Washington St
- 930 Pitner Ave Unit 3
- 1025 Wesley Ave
- 2321 Lee St
- 722 Brown Ave
- 1810 Monroe St
- 1723 Greenwood St
- 1310 Wesley Ave
- 604 Dodge Ave
- 1232 Ridge Ave
- 1916 Keeney St
- 1335 Asbury Ave
- 1402 Fowler Ave
- 1927 Warren St
- 1114 Main St Unit 1W
- 1112 Main St Unit 3E
- 647 Asbury Ave
- 1027 Dodge Ave Unit B
- 1027 Dodge Ave Unit 1027D
- 1027 Dodge Ave Unit 1027B
- 1027 Dodge Ave Unit 1027A
- 1027 Dodge Ave Unit C
- 1021 Dodge Ave Unit 1021D
- 1021 Dodge Ave Unit 1021A
- 1021 Dodge Ave Unit 1021B
- 1021 Dodge Ave Unit 1021C
- 1021 Dodge Ave Unit B
- 1021 Dodge Ave Unit D
- 1015 Dodge Ave
- 1011 Dodge Ave
- 1024 Darrow Ave
- 1026 Darrow Ave
- 1039 Dodge Ave
- 1018 Darrow Ave Unit 2
- 1018 Darrow Ave
- 1032 Darrow Ave
- 1016 Darrow Ave