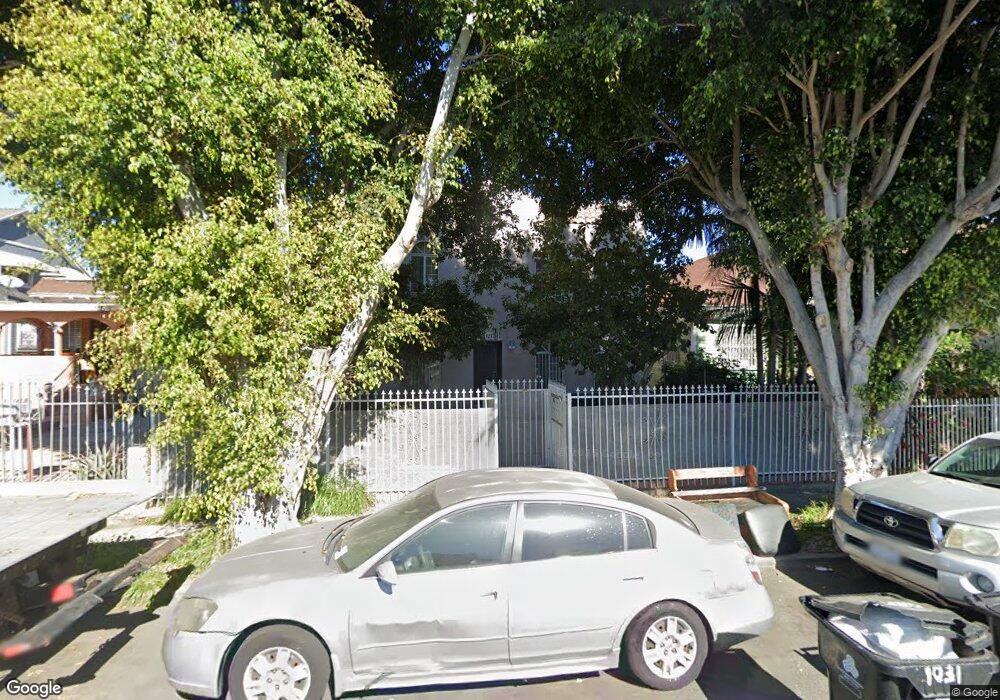
1027 E 22nd St Los Angeles, CA 90011
Historic South Central NeighborhoodEstimated Value: $899,000 - $1,087,000
5
Beds
4
Baths
3,286
Sq Ft
$293/Sq Ft
Est. Value
About This Home
This home is located at 1027 E 22nd St, Los Angeles, CA 90011 and is currently estimated at $961,667, approximately $292 per square foot. 1027 E 22nd St is a home located in Los Angeles County with nearby schools including San Pedro Street Elementary School, John Adams Middle School, and Santee Education Complex.
Ownership History
Date
Name
Owned For
Owner Type
Purchase Details
Closed on
Apr 30, 2004
Sold by
Ramirez Jose and Ramirez Lydia
Bought by
Quintero Ramon
Current Estimated Value
Home Financials for this Owner
Home Financials are based on the most recent Mortgage that was taken out on this home.
Original Mortgage
$127,700
Interest Rate
5.5%
Mortgage Type
New Conventional
Purchase Details
Closed on
Feb 18, 1994
Sold by
Silva Rosa
Bought by
Ramirez Jose
Home Financials for this Owner
Home Financials are based on the most recent Mortgage that was taken out on this home.
Original Mortgage
$90,000
Interest Rate
6.98%
Create a Home Valuation Report for This Property
The Home Valuation Report is an in-depth analysis detailing your home's value as well as a comparison with similar homes in the area
Home Values in the Area
Average Home Value in this Area
Purchase History
| Date | Buyer | Sale Price | Title Company |
|---|---|---|---|
| Quintero Ramon | -- | Security Union Title | |
| Ramirez Jose | -- | -- | |
| Ramirez Jose | -- | Pacific Title Guaranty Compa |
Source: Public Records
Mortgage History
| Date | Status | Borrower | Loan Amount |
|---|---|---|---|
| Closed | Quintero Ramon | $127,700 | |
| Closed | Ramirez Jose | $90,000 |
Source: Public Records
Tax History Compared to Growth
Tax History
| Year | Tax Paid | Tax Assessment Tax Assessment Total Assessment is a certain percentage of the fair market value that is determined by local assessors to be the total taxable value of land and additions on the property. | Land | Improvement |
|---|---|---|---|---|
| 2025 | $7,899 | $597,135 | $213,261 | $383,874 |
| 2024 | $7,899 | $585,428 | $209,080 | $376,348 |
| 2023 | $7,759 | $573,950 | $204,981 | $368,969 |
| 2022 | $7,426 | $562,697 | $200,962 | $361,735 |
| 2021 | $7,326 | $551,665 | $197,022 | $354,643 |
| 2019 | $7,124 | $535,304 | $191,179 | $344,125 |
| 2018 | $7,029 | $524,809 | $187,431 | $337,378 |
| 2016 | $6,665 | $504,431 | $180,153 | $324,278 |
| 2015 | $6,576 | $496,855 | $177,447 | $319,408 |
| 2014 | $6,620 | $487,124 | $173,972 | $313,152 |
Source: Public Records
Map
Nearby Homes