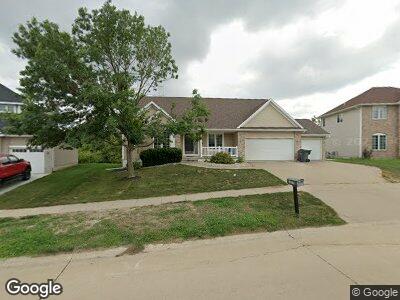
1027 Rolling Creek Dr NE Cedar Rapids, IA 52402
Estimated Value: $387,740 - $409,000
4
Beds
4
Baths
3,387
Sq Ft
$116/Sq Ft
Est. Value
About This Home
This home is located at 1027 Rolling Creek Dr NE, Cedar Rapids, IA 52402 and is currently estimated at $394,435, approximately $116 per square foot. 1027 Rolling Creek Dr NE is a home located in Linn County with nearby schools including Westfield Elementary School, Oak Ridge School, and Linn-Mar High School.
Ownership History
Date
Name
Owned For
Owner Type
Purchase Details
Closed on
Feb 10, 2021
Sold by
Cohanim Justin I
Bought by
Dorman Adriane L
Current Estimated Value
Home Financials for this Owner
Home Financials are based on the most recent Mortgage that was taken out on this home.
Original Mortgage
$254,150
Outstanding Balance
$230,738
Interest Rate
2.65%
Mortgage Type
New Conventional
Estimated Equity
$153,186
Purchase Details
Closed on
Aug 4, 2016
Sold by
Hanson Lee R and Hanson Lee
Bought by
Cohanim Jusitn I
Home Financials for this Owner
Home Financials are based on the most recent Mortgage that was taken out on this home.
Original Mortgage
$44,925
Interest Rate
3.41%
Mortgage Type
Commercial
Purchase Details
Closed on
May 3, 2002
Sold by
Jerrys Homes Inc
Bought by
Hanson Lee R and Hanson Linda Lou
Home Financials for this Owner
Home Financials are based on the most recent Mortgage that was taken out on this home.
Original Mortgage
$247,237
Interest Rate
6.95%
Create a Home Valuation Report for This Property
The Home Valuation Report is an in-depth analysis detailing your home's value as well as a comparison with similar homes in the area
Home Values in the Area
Average Home Value in this Area
Purchase History
| Date | Buyer | Sale Price | Title Company |
|---|---|---|---|
| Dorman Adriane L | $299,000 | None Available | |
| Cohanim Jusitn I | -- | None Available | |
| Hanson Lee R | $260,000 | -- | |
| Jerrys Homes Inc | -- | -- |
Source: Public Records
Mortgage History
| Date | Status | Borrower | Loan Amount |
|---|---|---|---|
| Open | Dorman Adriane L | $254,150 | |
| Previous Owner | Cohanim Justin I | $44,925 | |
| Previous Owner | Hanson Lee | $46,350 | |
| Previous Owner | Hanson Lee R | $49,800 | |
| Previous Owner | Hanson Lee R | $38,626 | |
| Previous Owner | Hanson Lee R | $27,010 | |
| Previous Owner | Hanson Lee R | $247,237 |
Source: Public Records
Tax History Compared to Growth
Tax History
| Year | Tax Paid | Tax Assessment Tax Assessment Total Assessment is a certain percentage of the fair market value that is determined by local assessors to be the total taxable value of land and additions on the property. | Land | Improvement |
|---|---|---|---|---|
| 2023 | $7,490 | $357,300 | $71,600 | $285,700 |
| 2022 | $6,984 | $327,700 | $64,500 | $263,200 |
| 2021 | $7,042 | $315,500 | $59,700 | $255,800 |
| 2020 | $7,042 | $299,900 | $54,900 | $245,000 |
| 2019 | $6,664 | $286,900 | $50,100 | $236,800 |
| 2018 | $6,380 | $286,900 | $50,100 | $236,800 |
| 2017 | $5,940 | $267,700 | $50,100 | $217,600 |
| 2016 | $5,717 | $255,600 | $50,100 | $205,500 |
| 2015 | $5,522 | $286,594 | $38,196 | $248,398 |
| 2014 | $6,222 | $286,594 | $38,196 | $248,398 |
| 2013 | $6,012 | $286,594 | $38,196 | $248,398 |
Source: Public Records
Map
Nearby Homes
- 925 Rolling Creek Dr NE
- 1023 Doubletree Ct NE Unit 1023
- 6520 Creekside Dr NE Unit 10
- 6715 Creekside Dr NE Unit 12
- 6723 Creekside Dr NE Unit 8
- 6615 Creekside Dr NE Unit 5
- 6615 Creekside Dr NE Unit 2
- 1325 Tower Ln NE
- 1333 Truman Ct NE Unit A
- 1331 Grant Ct NE Unit B
- 1331 Grant Ct NE Unit B
- 942 71st St NE
- 900 Chesterfield Rd NE
- 934 White Ivy Place NE
- 804 Arrowhead Ln NE
- 1312 Prairieview Dr NE
- 1153 74th St NE Unit 1153
- 1107 74th St NE
- 1237 74th St NE
- 1144 Crescent View Dr NE
- 1027 Rolling Creek Dr NE
- 1021 Rolling Creek Dr NE
- 1033 Rolling Creek Dr NE
- 1022 Rolling Creek Dr NE
- 1015 Rolling Creek Dr NE
- 1028 Rolling Creek Dr NE
- 1039 Rolling Creek Dr NE
- 1016 Rolling Creek Dr NE
- 1009 Rolling Creek Dr NE
- 1010 Rolling Creek Dr NE
- 1100 Rolling Creek Dr NE
- 6702 Spring Cove Ct NE
- 1003 Rolling Creek Dr NE
- 1004 Rolling Creek Dr NE
- 1111 Rolling Creek Dr NE
- 1106 Rolling Creek Dr NE
- 6708 Spring Cove Ct NE
- 1103 English Ln NE
- 934 Rolling Creek Dr NE
- 1112 Rolling Creek Dr NE