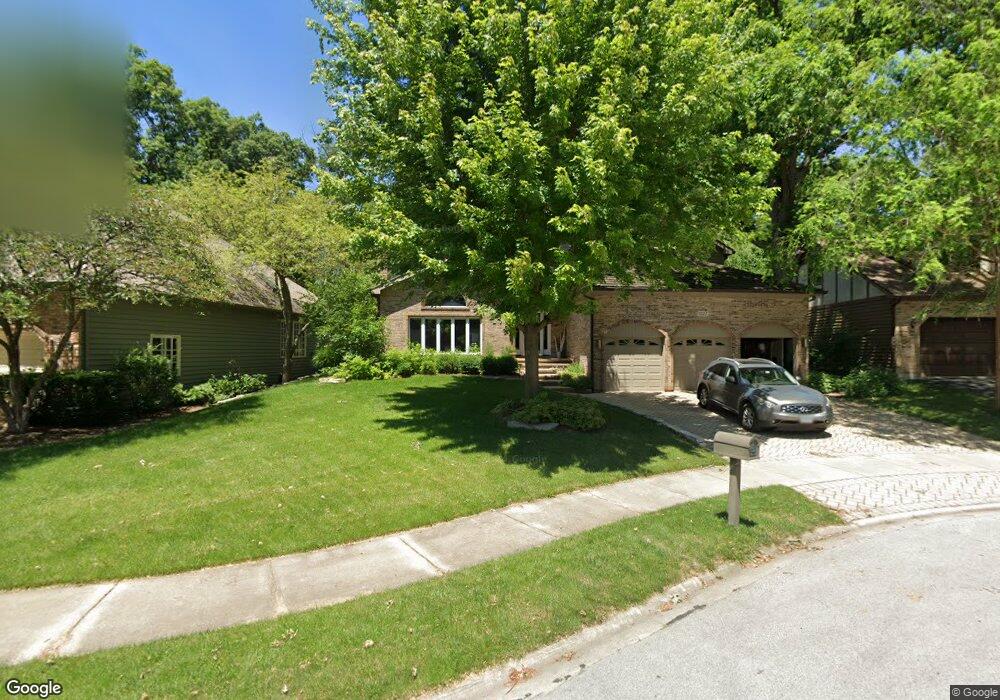
1027 Shimer Ct Naperville, IL 60565
Walnut Ridge NeighborhoodEstimated Value: $783,000 - $981,000
4
Beds
3
Baths
3,619
Sq Ft
$242/Sq Ft
Est. Value
About This Home
This home is located at 1027 Shimer Ct, Naperville, IL 60565 and is currently estimated at $874,327, approximately $241 per square foot. 1027 Shimer Ct is a home located in Will County with nearby schools including River Woods Elementary School, Madison Jr High School, and Naperville Central High School.
Ownership History
Date
Name
Owned For
Owner Type
Purchase Details
Closed on
Jun 8, 2007
Sold by
Mittelstaedt Robert F and Mittelstaedt Dorothy
Bought by
Ernst Peter M and Ernst Laurel A
Current Estimated Value
Home Financials for this Owner
Home Financials are based on the most recent Mortgage that was taken out on this home.
Original Mortgage
$191,000
Outstanding Balance
$154,030
Interest Rate
6.2%
Mortgage Type
Credit Line Revolving
Estimated Equity
$720,297
Purchase Details
Closed on
May 13, 2004
Sold by
Pauling Richard S and Shur Marcia J
Bought by
Mittelstaedt Robert F and Mittelstaedt Dorothy
Create a Home Valuation Report for This Property
The Home Valuation Report is an in-depth analysis detailing your home's value as well as a comparison with similar homes in the area
Home Values in the Area
Average Home Value in this Area
Purchase History
| Date | Buyer | Sale Price | Title Company |
|---|---|---|---|
| Ernst Peter M | $670,000 | Law Title Insurance | |
| Mittelstaedt Robert F | $570,000 | Multiple |
Source: Public Records
Mortgage History
| Date | Status | Borrower | Loan Amount |
|---|---|---|---|
| Open | Ernst Peter M | $191,000 | |
| Open | Ernst Peter M | $310,000 |
Source: Public Records
Tax History
| Year | Tax Paid | Tax Assessment Tax Assessment Total Assessment is a certain percentage of the fair market value that is determined by local assessors to be the total taxable value of land and additions on the property. | Land | Improvement |
|---|---|---|---|---|
| 2024 | $15,891 | $254,303 | $49,815 | $204,488 |
| 2023 | $15,891 | $228,813 | $44,822 | $183,991 |
| 2022 | $13,777 | $206,286 | $40,409 | $165,877 |
| 2021 | $12,863 | $192,881 | $37,783 | $155,098 |
| 2020 | $13,151 | $196,357 | $38,464 | $157,893 |
| 2019 | $12,611 | $187,006 | $36,632 | $150,374 |
| 2018 | $12,039 | $178,987 | $35,061 | $143,926 |
| 2017 | $11,596 | $169,656 | $33,233 | $136,423 |
| 2016 | $11,815 | $170,000 | $33,300 | $136,700 |
| 2015 | $12,285 | $163,000 | $31,900 | $131,100 |
| 2014 | $12,285 | $163,000 | $31,900 | $131,100 |
| 2013 | $12,285 | $158,300 | $31,000 | $127,300 |
Source: Public Records
Map
Nearby Homes
- 2250 Lisson Rd
- 2408 Barkdoll Rd
- 25 W 500 Royce Rd
- 460 Springwood Ln
- 2243 Aster Ct
- 4 Ridge Ct Unit 1
- 2549 River Woods Dr
- 1042 Churchill Dr Unit 12
- VACANT W Boughton Rd
- 1333 Purdue Ave
- 1406 River Oak Dr
- 191 Cassin Rd
- 561 Boardman Cir
- 265 Commonwealth Dr Unit 1
- 1909 Montclair Dr
- 44 Oak Bluff Ct
- 15 Pinnacle Ct
- 662 Sundance Dr
- 642 Sundance Dr
- 215 Brookwood Ln E
- 1023 Shimer Ct
- 1031 Shimer Ct
- 1019 Shimer Ct
- 1048 Caroline Ct
- 1026 Shimer Ct
- 1022 Shimer Ct
- 1022 Shimer Ct
- 1030 Shimer Ct
- 1015 Shimer Ct
- 1018 Shimer Ct
- 1044 Caroline Ct
- 1010 Shimer Ct
- 1011 Shimer Ct
- 2307 Fleetwood Ct
- 2311 Fleetwood Ct
- 1040 Caroline Ct
- 1006 Shimer Ct
- 1051 Caroline Ct
- 1007 Shimer Ct
- 2303 Fleetwood Ct
Your Personal Tour Guide
Ask me questions while you tour the home.