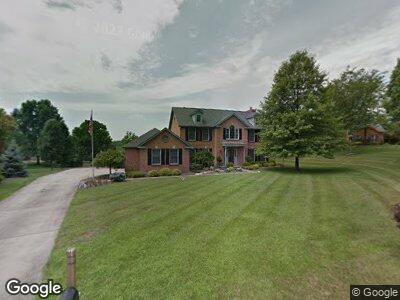
10275 Falling Waters Ln Cincinnati, OH 45241
Evendale NeighborhoodEstimated Value: $537,000 - $698,000
4
Beds
3
Baths
3,084
Sq Ft
$196/Sq Ft
Est. Value
About This Home
This home is located at 10275 Falling Waters Ln, Cincinnati, OH 45241 and is currently estimated at $604,393, approximately $195 per square foot. 10275 Falling Waters Ln is a home located in Hamilton County with nearby schools including Evendale Elementary School, Glendale Elementary School, and Princeton Community Middle School.
Ownership History
Date
Name
Owned For
Owner Type
Purchase Details
Closed on
Dec 19, 2024
Sold by
Fahrendorf Theresa Ann
Bought by
Theresa Ann Fahrendorf Trust and Fahrendorf
Current Estimated Value
Purchase Details
Closed on
Jun 7, 2017
Sold by
Hirnikel Leonard
Bought by
Fahrendorf Theresa A
Home Financials for this Owner
Home Financials are based on the most recent Mortgage that was taken out on this home.
Original Mortgage
$191,482
Interest Rate
3.91%
Mortgage Type
Future Advance Clause Open End Mortgage
Purchase Details
Closed on
May 17, 1996
Sold by
Kinsley Dennis R
Bought by
Hirnikel Leonard J and Fahrendorf Theresa A
Home Financials for this Owner
Home Financials are based on the most recent Mortgage that was taken out on this home.
Original Mortgage
$251,750
Interest Rate
8.05%
Create a Home Valuation Report for This Property
The Home Valuation Report is an in-depth analysis detailing your home's value as well as a comparison with similar homes in the area
Home Values in the Area
Average Home Value in this Area
Purchase History
| Date | Buyer | Sale Price | Title Company |
|---|---|---|---|
| Fahrendorf Theresa A | -- | None Available | |
| Hirnikel Leonard J | -- | -- | |
| Kinsley Dennis R | $265,000 | -- |
Source: Public Records
Mortgage History
| Date | Status | Borrower | Loan Amount |
|---|---|---|---|
| Previous Owner | Fahrendorf Theresa A | $100,000 | |
| Previous Owner | Fahrendorf Theresa A | $191,482 | |
| Previous Owner | Hirnikel Leonard J | $50,000 | |
| Previous Owner | Hirnikel Leonard J | $286,400 | |
| Previous Owner | Hirnikel Leonard J | $286,400 | |
| Previous Owner | Hirnikel Leonard J | $286,400 | |
| Previous Owner | Hirnikel Leonard J | $250,000 | |
| Previous Owner | Hirnikel Leonard J | $251,750 |
Source: Public Records
Tax History Compared to Growth
Tax History
| Year | Tax Paid | Tax Assessment Tax Assessment Total Assessment is a certain percentage of the fair market value that is determined by local assessors to be the total taxable value of land and additions on the property. | Land | Improvement |
|---|---|---|---|---|
| 2024 | $6,356 | $156,913 | $29,075 | $127,838 |
| 2023 | $6,362 | $156,913 | $29,075 | $127,838 |
| 2022 | $6,592 | $130,663 | $28,389 | $102,274 |
| 2021 | $6,408 | $130,663 | $28,389 | $102,274 |
| 2020 | $6,483 | $130,663 | $28,389 | $102,274 |
| 2019 | $6,293 | $116,662 | $25,347 | $91,315 |
| 2018 | $5,902 | $116,662 | $25,347 | $91,315 |
| 2017 | $5,526 | $116,662 | $25,347 | $91,315 |
| 2016 | $5,627 | $117,817 | $25,095 | $92,722 |
| 2015 | $5,682 | $117,817 | $25,095 | $92,722 |
| 2014 | $5,701 | $117,817 | $25,095 | $92,722 |
| 2013 | $5,624 | $119,007 | $25,347 | $93,660 |
Source: Public Records
Map
Nearby Homes
- 10280 Claxton Trail
- 10561 Margate Terrace
- 3700 Carpenters Creek Dr
- 10464 Wintergreen Ct
- 22 Heritage Ct
- 47 Carpenters Ridge
- 3454 Harborway Ln
- 3826 Alba Ct
- 10775 Lemarie Dr
- 3862 Chimney Hill Dr
- 3263 Cooper Rd
- 1121 Main St
- 4016 Creek Rd
- 10507 Retreat Walk
- 10974 Thornview Dr
- 4191 Parkview Dr
- 5090 Arabella Cir
- 10748 Plainfield Rd
- 5048 Arabella Cir
- 9963 Timbers Dr
- 10275 Falling Waters Ln
- 10275 Falling Waters Ln
- 10267 Falling Waters Ln
- 10281 Falling Waters Ln
- 10254 Normandy Close
- 10252 Normandy Close
- 10290 Falling Waters Ln
- 10261 Falling Waters Ln
- 10270 Falling Waters Ln
- 10250 Normandy Close
- 10283 Falling Waters Ln
- 10253 Normandy Close
- 10260 Falling Waters Ln
- 10285 Falling Waters Ln
- 10284 Falling Waters Ln
- 10245 Falling Waters Ln
- 3355 Braewood Dr
- 3347 Braewood Dr
- 10251 Normandy Close
- 10240 Normandy Close