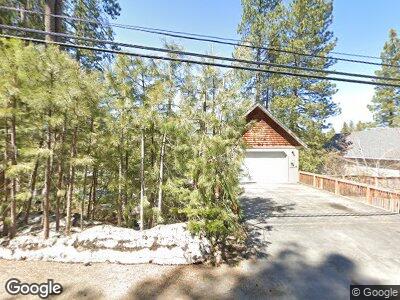
10276 Reynold Way Truckee, CA 96161
Joerger Ranch NeighborhoodEstimated Value: $829,548 - $2,010,000
3
Beds
3
Baths
2,418
Sq Ft
$538/Sq Ft
Est. Value
About This Home
This home is located at 10276 Reynold Way, Truckee, CA 96161 and is currently estimated at $1,301,887, approximately $538 per square foot. 10276 Reynold Way is a home located in Nevada County with nearby schools including Truckee Elementary School, Alder Creek Middle School, and Tahoe Truckee High School.
Ownership History
Date
Name
Owned For
Owner Type
Purchase Details
Closed on
Sep 29, 2017
Sold by
Saunders Daniel J and The Saunders Family Trust
Bought by
Saunders Rendan
Current Estimated Value
Purchase Details
Closed on
Feb 7, 2002
Sold by
Saunders Daniel J and Saunders Beatrice P
Bought by
Saunders Daniel J and Saunders Beatrice P
Purchase Details
Closed on
Jun 13, 2000
Sold by
Powers Matthew A and Powers Tamara A
Bought by
Saunders Daniel J and Saunders Beatrice P
Home Financials for this Owner
Home Financials are based on the most recent Mortgage that was taken out on this home.
Original Mortgage
$247,500
Interest Rate
8.27%
Purchase Details
Closed on
Jun 18, 1998
Sold by
Breeden James
Bought by
Powers Matthew A and Powers Tamara A
Home Financials for this Owner
Home Financials are based on the most recent Mortgage that was taken out on this home.
Original Mortgage
$172,000
Interest Rate
7.17%
Create a Home Valuation Report for This Property
The Home Valuation Report is an in-depth analysis detailing your home's value as well as a comparison with similar homes in the area
Home Values in the Area
Average Home Value in this Area
Purchase History
| Date | Buyer | Sale Price | Title Company |
|---|---|---|---|
| Saunders Rendan | -- | None Available | |
| Saunders Daniel J | -- | -- | |
| Saunders Daniel J | $310,000 | First American Title Ins Co | |
| Powers Matthew A | $179,000 | -- |
Source: Public Records
Mortgage History
| Date | Status | Borrower | Loan Amount |
|---|---|---|---|
| Open | Saunders Daniel J | $230,000 | |
| Closed | Saunders Daniel J | $247,500 | |
| Previous Owner | Powers Matthew A | $172,000 |
Source: Public Records
Tax History Compared to Growth
Tax History
| Year | Tax Paid | Tax Assessment Tax Assessment Total Assessment is a certain percentage of the fair market value that is determined by local assessors to be the total taxable value of land and additions on the property. | Land | Improvement |
|---|---|---|---|---|
| 2024 | $6,655 | $477,358 | $135,602 | $341,756 |
| 2023 | $6,655 | $467,999 | $132,944 | $335,055 |
| 2022 | $6,441 | $458,824 | $130,338 | $328,486 |
| 2021 | $6,100 | $449,829 | $127,783 | $322,046 |
| 2020 | $6,051 | $445,217 | $126,473 | $318,744 |
| 2019 | $6,035 | $436,489 | $123,994 | $312,495 |
| 2018 | $5,507 | $427,931 | $121,563 | $306,368 |
| 2017 | $5,371 | $419,541 | $119,180 | $300,361 |
| 2016 | $5,325 | $411,316 | $116,844 | $294,472 |
| 2015 | $5,143 | $405,139 | $115,089 | $290,050 |
| 2014 | $5,143 | $397,204 | $112,835 | $284,369 |
Source: Public Records
Map
Nearby Homes
- 10118 Reynold Way
- 10462 Martis Dr
- 00000 Brockway Rd Unit Martis Drive
- 10346 Jeffery Pine Rd Unit 2
- 10895 River View Dr Unit A
- 10294 Sugar Pine Rd
- 10559 Sara Bear Ln
- 10259 Kylan Creek Ct
- 11748 Old Mill Rd
- 10647 Sara Bear Ln
- 11736 Hope Ct Unit A
- 10068 Olympic Blvd
- 10287 Palisades Dr Unit 1
- 10336 Palisades Dr
- 10110 Soaring Way
- 11898 Hope Ct Unit B
- 9234 Heartwood Dr
- 10113 Corrie Ct
- 9264 Heartwood Dr
- 9185 Heartwood Dr