1028 Dempsey Rd Milpitas, CA 95035
Estimated Value: $1,267,000 - $1,533,000
2
Beds
2
Baths
1,271
Sq Ft
$1,083/Sq Ft
Est. Value
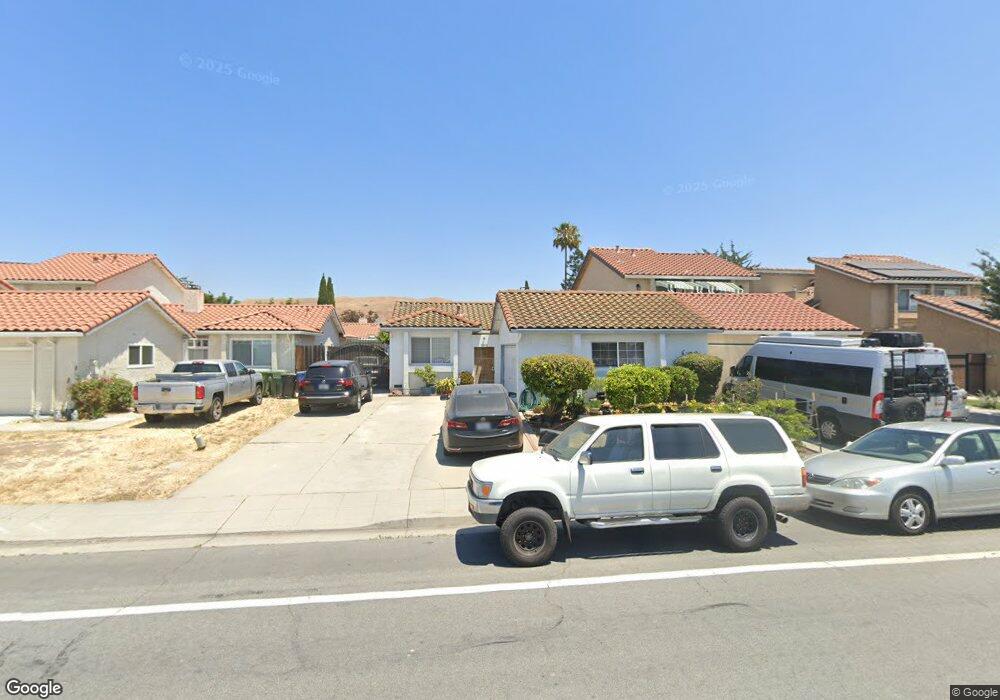
About This Home
This home is located at 1028 Dempsey Rd, Milpitas, CA 95035 and is currently estimated at $1,377,106, approximately $1,083 per square foot. 1028 Dempsey Rd is a home located in Santa Clara County with nearby schools including John Sinnott Elementary School, Rancho Milpitas Middle School, and Milpitas High School.
Ownership History
Date
Name
Owned For
Owner Type
Purchase Details
Closed on
Dec 14, 2004
Sold by
Towhid Mason
Bought by
Nguyen Kathy P
Current Estimated Value
Home Financials for this Owner
Home Financials are based on the most recent Mortgage that was taken out on this home.
Original Mortgage
$240,000
Outstanding Balance
$115,282
Interest Rate
5.12%
Mortgage Type
New Conventional
Estimated Equity
$1,261,824
Purchase Details
Closed on
Feb 19, 2004
Sold by
Bachmid Widad
Bought by
Towhid Mason
Purchase Details
Closed on
Nov 18, 2002
Sold by
Saied Raffat and Saied Muzna
Bought by
Kinnaird Lucy
Home Financials for this Owner
Home Financials are based on the most recent Mortgage that was taken out on this home.
Original Mortgage
$308,000
Interest Rate
7.75%
Create a Home Valuation Report for This Property
The Home Valuation Report is an in-depth analysis detailing your home's value as well as a comparison with similar homes in the area
Home Values in the Area
Average Home Value in this Area
Purchase History
| Date | Buyer | Sale Price | Title Company |
|---|---|---|---|
| Nguyen Kathy P | $475,000 | Chicago Title | |
| Towhid Mason | -- | Chicago Title | |
| Towhid Mason | $15,000 | Chicago Title | |
| Kinnaird Lucy | $385,000 | Chicago Title |
Source: Public Records
Mortgage History
| Date | Status | Borrower | Loan Amount |
|---|---|---|---|
| Open | Nguyen Kathy P | $240,000 | |
| Previous Owner | Kinnaird Lucy | $308,000 | |
| Closed | Kinnaird Lucy | $77,000 |
Source: Public Records
Tax History Compared to Growth
Tax History
| Year | Tax Paid | Tax Assessment Tax Assessment Total Assessment is a certain percentage of the fair market value that is determined by local assessors to be the total taxable value of land and additions on the property. | Land | Improvement |
|---|---|---|---|---|
| 2025 | $7,688 | $662,088 | $313,619 | $348,469 |
| 2024 | $7,688 | $649,107 | $307,470 | $341,637 |
| 2023 | $7,664 | $636,381 | $301,442 | $334,939 |
| 2022 | $7,634 | $623,904 | $295,532 | $328,372 |
| 2021 | $7,524 | $611,672 | $289,738 | $321,934 |
| 2020 | $7,394 | $605,401 | $286,768 | $318,633 |
| 2019 | $7,311 | $593,532 | $281,146 | $312,386 |
| 2018 | $6,945 | $581,895 | $275,634 | $306,261 |
| 2017 | $6,776 | $570,486 | $270,230 | $300,256 |
| 2016 | $6,501 | $559,301 | $264,932 | $294,369 |
| 2015 | $6,434 | $550,901 | $260,953 | $289,948 |
| 2014 | $6,257 | $540,111 | $255,842 | $284,269 |
Source: Public Records
Map
Nearby Homes
- 943 Matterhorn Ct
- 1536 Sonoma Dr
- 1710 Clear Lake Ave
- 861 Garden St
- 813 Garden St
- 1455 Cherry Cir
- 3139 Laneview Dr
- 496 Dempsey Rd Unit 199
- 1421 Nightshade Rd Unit 31
- 1452 Nightshade Rd Unit 40
- 1435 Nightshade Rd Unit 40
- 621 Clover Cir
- 3108 Kermath Dr
- 2085 Ashwood Ln
- 2075 Lakewood Dr
- 1501 Canton Dr
- 2625 Autumnvale Dr
- 2664 Autumnvale Dr
- 2158 Capitol Park Ct
- 2327 Farmcrest St
- 1034 Dempsey Rd
- 1022 Dempsey Rd
- 1040 Dempsey Rd
- 1016 Dempsey Rd
- 1027 Big Bear Ct
- 1021 Big Bear Ct
- 1010 Dempsey Rd
- 1046 Dempsey Rd
- 1033 Big Bear Ct
- 1015 Big Bear Ct
- 1039 Big Bear Ct
- 1009 Big Bear Ct
- 1300 Mount Shasta Ave
- 1052 Dempsey Rd
- 1045 Big Bear Ct
- 1306 Mount Shasta Ave
- 1051 Big Bear Ct
- 1058 Dempsey Rd
- 1057 Big Bear Ct
- 1060 Dempsey Rd