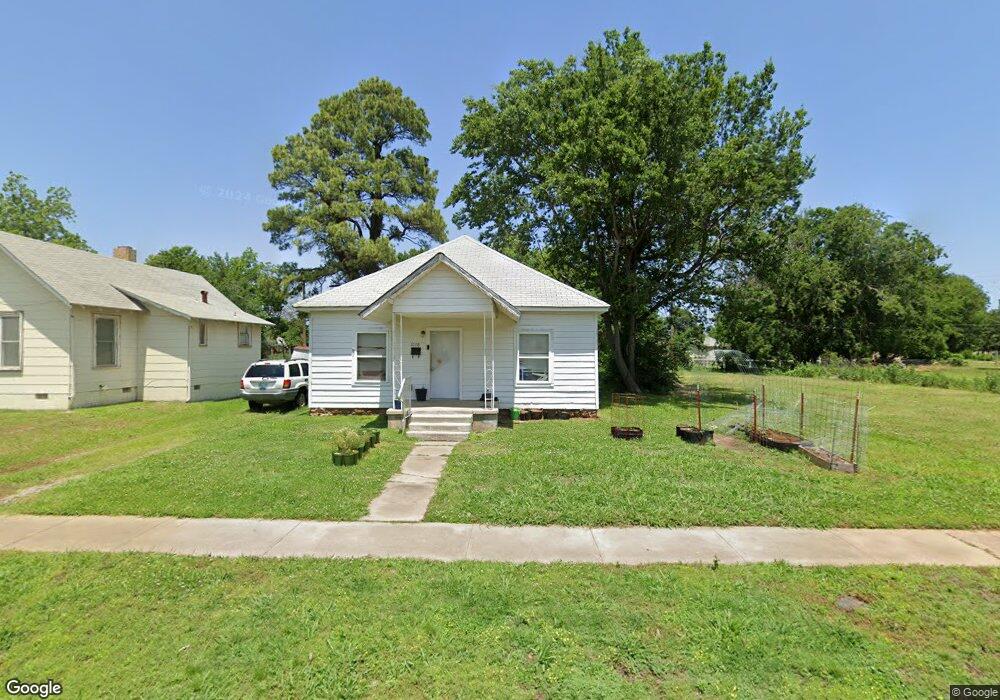
1028 E Oak St Cushing, OK 74023
Estimated Value: $68,445 - $83,000
2
Beds
1
Bath
994
Sq Ft
$75/Sq Ft
Est. Value
About This Home
This home is located at 1028 E Oak St, Cushing, OK 74023 and is currently estimated at $74,361, approximately $74 per square foot. 1028 E Oak St is a home located in Payne County with nearby schools including Cushing Upper Elementary School, Cushing Lower Elementary School, and Cushing High School.
Ownership History
Date
Name
Owned For
Owner Type
Purchase Details
Closed on
Dec 18, 2020
Sold by
Harkleroad Anthony R and Harkleroad Linda K
Bought by
Anthony Harkleroad Rentals Llc
Current Estimated Value
Home Financials for this Owner
Home Financials are based on the most recent Mortgage that was taken out on this home.
Original Mortgage
$35,200
Outstanding Balance
$25,371
Interest Rate
2.7%
Mortgage Type
New Conventional
Estimated Equity
$48,990
Purchase Details
Closed on
Jul 31, 2014
Sold by
Medlock Anita Sue and Holderread Jerry O
Bought by
Harkleroad Anthony R and Harkleroad Linda K
Home Financials for this Owner
Home Financials are based on the most recent Mortgage that was taken out on this home.
Original Mortgage
$25,200
Interest Rate
4.2%
Mortgage Type
Purchase Money Mortgage
Purchase Details
Closed on
Nov 12, 2009
Sold by
Holderread Oliver P and Holderread Oretta G
Bought by
Holderread Oliver P and Holderread Oretta G
Create a Home Valuation Report for This Property
The Home Valuation Report is an in-depth analysis detailing your home's value as well as a comparison with similar homes in the area
Purchase History
| Date | Buyer | Sale Price | Title Company |
|---|---|---|---|
| Anthony Harkleroad Rentals Llc | -- | None Available | |
| Harkleroad Anthony R | $31,500 | None Available | |
| Holderread Oliver P | -- | -- |
Source: Public Records
Mortgage History
| Date | Status | Borrower | Loan Amount |
|---|---|---|---|
| Open | Anthony Harkleroad Rentals Llc | $35,200 | |
| Closed | Harkleroad Anthony R | $25,200 |
Source: Public Records
Tax History
| Year | Tax Paid | Tax Assessment Tax Assessment Total Assessment is a certain percentage of the fair market value that is determined by local assessors to be the total taxable value of land and additions on the property. | Land | Improvement |
|---|---|---|---|---|
| 2025 | $434 | $4,665 | $335 | $4,330 |
| 2024 | $395 | $4,665 | $335 | $4,330 |
| 2023 | $395 | $4,443 | $504 | $3,939 |
| 2022 | $361 | $4,232 | $480 | $3,752 |
| 2021 | $334 | $4,030 | $488 | $3,542 |
| 2020 | $314 | $3,838 | $436 | $3,402 |
| 2019 | $313 | $3,656 | $570 | $3,086 |
| 2018 | $303 | $3,656 | $570 | $3,086 |
| 2017 | $301 | $3,656 | $570 | $3,086 |
| 2016 | $301 | $3,559 | $493 | $3,066 |
| 2015 | $293 | $3,389 | $359 | $3,030 |
| 2014 | $52 | $605 | $359 | $246 |
Source: Public Records
Map
Nearby Homes
- 933 E Maple St
- 915 E Oak St
- 1002 E Cherry St
- 112 S Highland Ave
- 1301 E Ash St
- 1224 E Cherry St
- 1217 E Cherry St
- 919 E 2nd St
- 1318 E Oak St
- 1236 E Main St
- 732 E Broadway St
- 724 E Moses St
- 1001 E Pecan St
- 708 E Broadway St
- 1003 E 4th St
- 1133 E Pecan St
- 843 E 4th St
- 1417 E Oak St
- 1129 E Vine St
- 1436 E Moses St
Your Personal Tour Guide
Ask me questions while you tour the home.