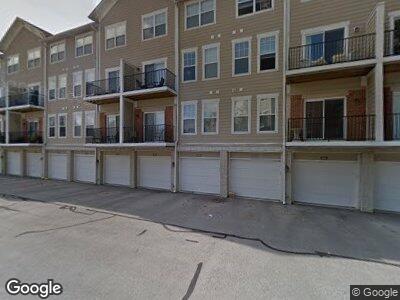
1028 Reserve Way Indianapolis, IN 46220
Broad Ripple NeighborhoodEstimated Value: $349,923 - $362,000
2
Beds
2
Baths
1,971
Sq Ft
$180/Sq Ft
Est. Value
About This Home
This home is located at 1028 Reserve Way, Indianapolis, IN 46220 and is currently estimated at $354,981, approximately $180 per square foot. 1028 Reserve Way is a home located in Marion County with nearby schools including James Whitcomb Riley School 43, Arsenal Technical High School, and George Washington Community High School (9-12).
Ownership History
Date
Name
Owned For
Owner Type
Purchase Details
Closed on
Jul 13, 2022
Sold by
Ryan Jeffrey A and Ryan Kimberly D
Bought by
Quinlan John Ryan
Current Estimated Value
Home Financials for this Owner
Home Financials are based on the most recent Mortgage that was taken out on this home.
Original Mortgage
$274,400
Outstanding Balance
$260,633
Interest Rate
4%
Mortgage Type
New Conventional
Estimated Equity
$98,802
Purchase Details
Closed on
May 25, 2017
Sold by
Andrew D
Bought by
Jeffrey A
Purchase Details
Closed on
Jun 3, 2005
Sold by
Westfield Reserve Llc
Bought by
Hollenbeck Andrew D
Home Financials for this Owner
Home Financials are based on the most recent Mortgage that was taken out on this home.
Original Mortgage
$210,220
Interest Rate
5.25%
Mortgage Type
Adjustable Rate Mortgage/ARM
Create a Home Valuation Report for This Property
The Home Valuation Report is an in-depth analysis detailing your home's value as well as a comparison with similar homes in the area
Home Values in the Area
Average Home Value in this Area
Purchase History
| Date | Buyer | Sale Price | Title Company |
|---|---|---|---|
| Quinlan John Ryan | -- | Schmitz David A | |
| Jeffrey A | $258,800 | -- | |
| Ryan Jeffrey A | $258,800 | Title Service, Llc | |
| Hollenbeck Andrew D | -- | None Available |
Source: Public Records
Mortgage History
| Date | Status | Borrower | Loan Amount |
|---|---|---|---|
| Open | Quinlan John Ryan | $274,400 | |
| Previous Owner | Ryan Jeffrey A | $150,000 | |
| Previous Owner | Ryan Jeffrey A | $81,000 | |
| Previous Owner | Hollenbeck Andrew D | $210,220 | |
| Previous Owner | Hollenbeck Andrew D | $38,000 |
Source: Public Records
Tax History Compared to Growth
Tax History
| Year | Tax Paid | Tax Assessment Tax Assessment Total Assessment is a certain percentage of the fair market value that is determined by local assessors to be the total taxable value of land and additions on the property. | Land | Improvement |
|---|---|---|---|---|
| 2024 | $4,247 | $334,800 | $26,700 | $308,100 |
| 2023 | $4,247 | $351,800 | $26,800 | $325,000 |
| 2022 | $3,910 | $321,800 | $26,700 | $295,100 |
| 2021 | $3,325 | $281,300 | $26,500 | $254,800 |
| 2020 | $3,307 | $278,000 | $26,400 | $251,600 |
| 2019 | $3,313 | $273,000 | $26,500 | $246,500 |
| 2018 | $3,300 | $269,500 | $26,500 | $243,000 |
| 2017 | $2,670 | $246,200 | $26,400 | $219,800 |
| 2016 | $4,983 | $237,600 | $26,300 | $211,300 |
| 2014 | $5,081 | $235,000 | $26,900 | $208,100 |
| 2013 | $2,602 | $247,900 | $27,100 | $220,800 |
Source: Public Records
Map
Nearby Homes
- 1064 Reserve Way
- 1074 Reserve Way
- 1053 Reserve Way
- 952 Junction Place
- 6665 Boxcar Place
- 6595 Reserve Dr
- 907 Junction Place Unit 41907
- 6639 N College Ave
- 6916 Ralph Ct
- 6560 Dawson Lake Dr
- 1127 Island Woods Dr Unit 56
- 1234 E 71st St
- 1212 River Heights Dr
- 6625 Riverfront Ave
- 7060 N Park Ave
- 6307 Broadway St
- 7002 N Ralston Ave
- 1802 E 66th St
- 6348 Kingsley Dr
- 6996 N Washington Blvd
- 1028 Reserve Way
- 1028 Reserve Way Unit 4
- 1024 Reserve Way
- 1032 Reserve Way
- 1026 Reserve Way Unit 4
- 1018 Reserve Way
- 1030 Reserve Way
- 1036 Reserve Way
- 1020 Reserve Way Unit 4
- 1014 Reserve Way
- 1014 Reserve Way Unit 4
- 1014 Reserve Way Unit 1014
- 1034 Reserve Way
- 1034 Reserve Way Unit 4-1034
- 1016 Reserve Way
- 1040 Reserve Way
- 1010 Reserve Way
- 1010 Reserve Way Unit 4
- 1038 Reserve Way