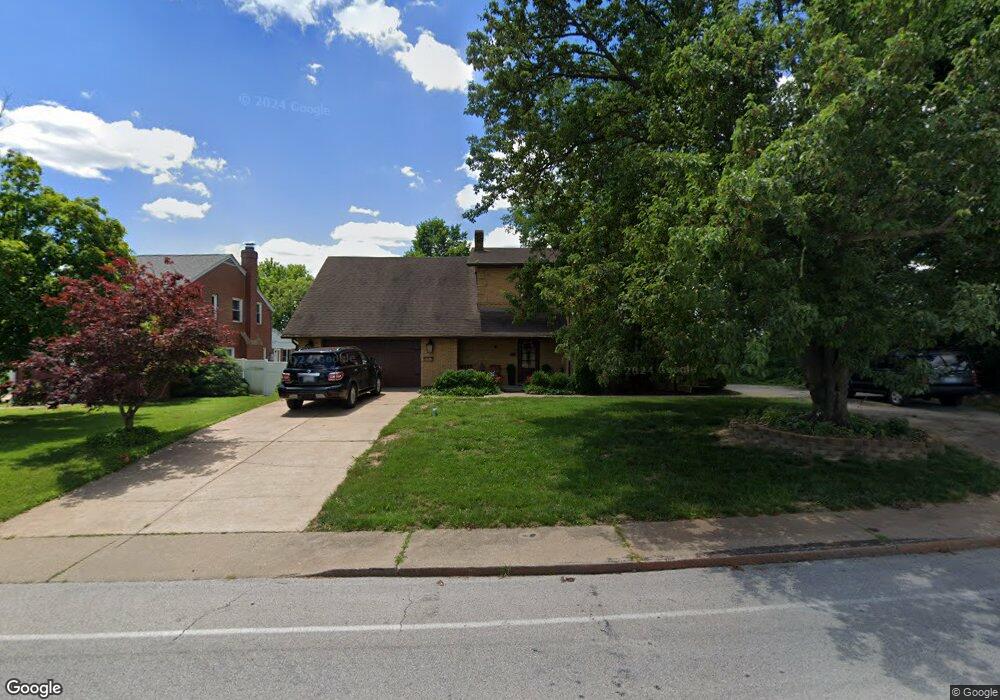
1028 W Main St Festus, MO 63028
Festus/Crystal City NeighborhoodEstimated Value: $271,000 - $342,000
3
Beds
5
Baths
2,723
Sq Ft
$109/Sq Ft
Est. Value
About This Home
This home is located at 1028 W Main St, Festus, MO 63028 and is currently estimated at $297,891, approximately $109 per square foot. 1028 W Main St is a home located in Jefferson County with nearby schools including Festus Elementary School, Festus Intermediate School, and Festus Middle School.
Ownership History
Date
Name
Owned For
Owner Type
Purchase Details
Closed on
Sep 10, 2013
Sold by
U S Bank Na
Bought by
Snyder Amy and Snyder Ricky J
Current Estimated Value
Home Financials for this Owner
Home Financials are based on the most recent Mortgage that was taken out on this home.
Original Mortgage
$119,557
Outstanding Balance
$89,429
Interest Rate
4.46%
Mortgage Type
New Conventional
Estimated Equity
$208,462
Purchase Details
Closed on
Mar 8, 2013
Sold by
Smith Hayes Colby R and Smith Hayes Mary Beth
Bought by
Us Bank Na and Bs Abs 2006-St1
Purchase Details
Closed on
Dec 2, 2004
Sold by
Breeze Kurt D and Breeze Cynthia A
Bought by
Smith Hynes Colby R and Smith Hynes Mary Beth
Home Financials for this Owner
Home Financials are based on the most recent Mortgage that was taken out on this home.
Original Mortgage
$281,200
Interest Rate
5.68%
Mortgage Type
Purchase Money Mortgage
Create a Home Valuation Report for This Property
The Home Valuation Report is an in-depth analysis detailing your home's value as well as a comparison with similar homes in the area
Home Values in the Area
Average Home Value in this Area
Purchase History
| Date | Buyer | Sale Price | Title Company |
|---|---|---|---|
| Snyder Amy | -- | Stewart Title | |
| Us Bank Na | $128,500 | None Available | |
| Smith Hynes Colby R | -- | -- |
Source: Public Records
Mortgage History
| Date | Status | Borrower | Loan Amount |
|---|---|---|---|
| Open | Snyder Amy | $119,557 | |
| Previous Owner | Smith Hynes Colby R | $281,200 |
Source: Public Records
Tax History Compared to Growth
Tax History
| Year | Tax Paid | Tax Assessment Tax Assessment Total Assessment is a certain percentage of the fair market value that is determined by local assessors to be the total taxable value of land and additions on the property. | Land | Improvement |
|---|---|---|---|---|
| 2025 | $1,982 | $38,100 | $1,800 | $36,300 |
| 2024 | $1,982 | $35,000 | $1,800 | $33,200 |
| 2023 | $1,982 | $35,000 | $1,800 | $33,200 |
| 2022 | $1,971 | $35,000 | $1,800 | $33,200 |
| 2021 | $1,973 | $35,000 | $1,800 | $33,200 |
| 2020 | $1,864 | $31,000 | $1,400 | $29,600 |
| 2019 | $1,863 | $31,000 | $1,400 | $29,600 |
| 2018 | $1,680 | $31,000 | $1,400 | $29,600 |
| 2017 | $1,680 | $31,000 | $1,400 | $29,600 |
| 2016 | $1,520 | $27,900 | $1,500 | $26,400 |
| 2015 | $1,511 | $27,900 | $1,500 | $26,400 |
| 2013 | -- | $30,900 | $1,500 | $29,400 |
Source: Public Records
Map
Nearby Homes
- 918 S 2nd St
- 906 Parkview Dr
- 21 Flora Dr
- 206 Belle Ave
- 624 Westwood South Dr Unit A
- 524 Jennifer Ct
- 1417 Westvale Dr
- 312 Sunshine Dr
- 814 N 5th St
- 601 S 5th St
- 506 S 4th St
- 725 Woodrow Ave
- 1321 Melvin Dr
- 1325 Melvin Dr
- 308 S 5th St
- 707 Jerome Dr
- 903 Huber St
- 812 Ridge Ave
- 0 Tbb Birchwood Overlook -Pin Oa Unit MAR24022705
- 514 Warne St
- 1020 W Main St
- 1017 S 2nd St
- 1021 S 2nd St
- 1010 W Main St
- 1000 W Main St
- 1003 S 2nd St
- 1019 W Main St
- 1011 W Main St
- 27 W Ridge Lot
- 1001 S 2nd St
- 1007 W Main St
- 0 Scenic View Condos Unit 80020146
- 948 W Main St
- 104 Hancock Ct
- 1003 W Main St
- 1020 S 2nd St
- 949 S 2nd St
- 1014 S 2nd St
- 1008 S 2nd St
- 1012 S 2nd St