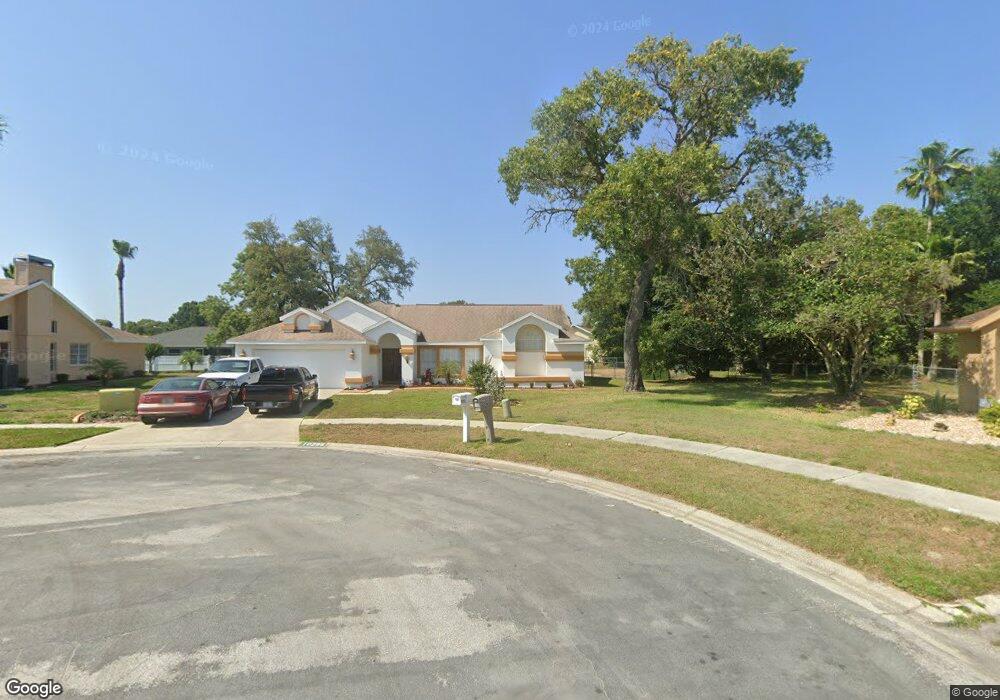
10285 Windsor Ct Spring Hill, FL 34608
Estimated Value: $332,135 - $371,000
3
Beds
2
Baths
1,951
Sq Ft
$180/Sq Ft
Est. Value
About This Home
This home is located at 10285 Windsor Ct, Spring Hill, FL 34608 and is currently estimated at $351,284, approximately $180 per square foot. 10285 Windsor Ct is a home located in Hernando County with nearby schools including Suncoast Elementary School, Powell Middle School, and Frank W. Springstead High School.
Ownership History
Date
Name
Owned For
Owner Type
Purchase Details
Closed on
Jun 15, 2015
Sold by
Barbieri John P and Barbieri Bonnie
Bought by
Collins Stephen and Collins Lisa
Current Estimated Value
Home Financials for this Owner
Home Financials are based on the most recent Mortgage that was taken out on this home.
Original Mortgage
$72,183
Interest Rate
3.88%
Mortgage Type
Seller Take Back
Purchase Details
Closed on
Apr 13, 2004
Sold by
Reynolds John C and Reynolds Martha Anne
Bought by
Barbieri John P and Barbieri Bonnie
Purchase Details
Closed on
Aug 13, 2001
Sold by
Zefferys Constantine J and Zefferys Agnes
Bought by
Reynolds John C and Reynolds Martha Anne
Purchase Details
Closed on
Apr 28, 1997
Sold by
Weiss Barbara Lee
Bought by
Zefferys Constantine J and Zefferys Agnes
Home Financials for this Owner
Home Financials are based on the most recent Mortgage that was taken out on this home.
Original Mortgage
$53,000
Interest Rate
7.95%
Create a Home Valuation Report for This Property
The Home Valuation Report is an in-depth analysis detailing your home's value as well as a comparison with similar homes in the area
Home Values in the Area
Average Home Value in this Area
Purchase History
| Date | Buyer | Sale Price | Title Company |
|---|---|---|---|
| Collins Stephen | $70,000 | Attorney | |
| Barbieri John P | $170,000 | Chelsea Title Of The Nature | |
| Reynolds John C | $149,500 | -- | |
| Zefferys Constantine J | $108,000 | -- |
Source: Public Records
Mortgage History
| Date | Status | Borrower | Loan Amount |
|---|---|---|---|
| Closed | Collins Stephen | $72,183 | |
| Previous Owner | Zefferys Constantine J | $53,000 |
Source: Public Records
Tax History
| Year | Tax Paid | Tax Assessment Tax Assessment Total Assessment is a certain percentage of the fair market value that is determined by local assessors to be the total taxable value of land and additions on the property. | Land | Improvement |
|---|---|---|---|---|
| 2025 | $1,667 | $105,111 | -- | -- |
| 2024 | $1,568 | $102,149 | -- | -- |
| 2023 | $1,568 | $99,174 | $0 | $0 |
| 2022 | $1,474 | $96,285 | $0 | $0 |
| 2021 | $1,459 | $93,481 | $0 | $0 |
| 2020 | $1,360 | $92,190 | $0 | $0 |
| 2019 | $1,350 | $90,117 | $0 | $0 |
| 2018 | $749 | $88,437 | $0 | $0 |
| 2017 | $1,058 | $86,618 | $0 | $0 |
| 2016 | $1,022 | $84,836 | $0 | $0 |
| 2015 | $1,488 | $68,751 | $0 | $0 |
Source: Public Records
Map
Nearby Homes
- 10344 Henderson St
- 10340 Ventura Dr
- 10348 Ventura Dr
- 1215 Gatewood Ave
- 1339 Overland Dr
- 1150 Bentley Ave
- 1474 Coble Rd
- 10290 Bannock St
- 10421 Templewood Ct
- 1139 Bentley Ave
- 1350 Gatewood Ave
- 10351 Flag Rd
- 10154 Henderson St
- 1170 Barger Ave
- 1542 Overland Dr
- LOT 4 Galt Ln
- 1039 Greenturf Rd
- 10464 Henderson St
- 10237 Carrin Rd
- 1394 Escobar Ave
- 10281 Windsor Ct
- 10290 Sharkey Ct
- 10296 Windsor Ct
- 10284 Sharkey Ct
- 10294 Sharkey Ct
- 10273 Windsor Ct
- 10288 Windsor Ct
- 10282 Windsor Ct
- 10272 Sharkey Ct
- 10295 Sharkey Ct
- 10274 Windsor Ct
- 10293 Rosetti Ct
- 10289 Sharkey Ct
- 10283 Sharkey Ct
- 10314 Audie Brook Dr
- 1245 Overland Dr
- 10297 Rosetti Ct
- 1259 Overland Dr
- 1239 Overland Dr
- 10271 Sharkey Ct
Your Personal Tour Guide
Ask me questions while you tour the home.