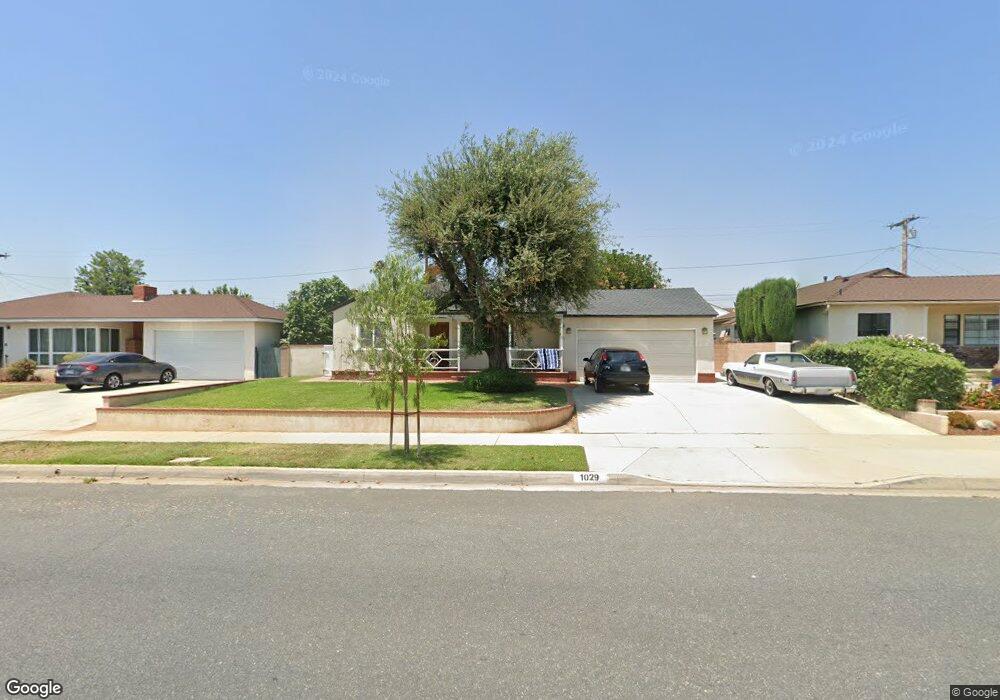
1029 E Ruddock St Covina, CA 91724
Estimated Value: $761,000 - $817,000
3
Beds
2
Baths
1,292
Sq Ft
$604/Sq Ft
Est. Value
About This Home
This home is located at 1029 E Ruddock St, Covina, CA 91724 and is currently estimated at $779,895, approximately $603 per square foot. 1029 E Ruddock St is a home located in Los Angeles County with nearby schools including Badillo Elementary School, Royal Oak Middle School, and Charter Oak High School.
Ownership History
Date
Name
Owned For
Owner Type
Purchase Details
Closed on
Jul 12, 2002
Sold by
Kane Sandra
Bought by
Kane Sandra
Current Estimated Value
Home Financials for this Owner
Home Financials are based on the most recent Mortgage that was taken out on this home.
Original Mortgage
$141,500
Interest Rate
6.69%
Purchase Details
Closed on
Nov 30, 1998
Sold by
Kane Byron
Bought by
Kane Sandra
Home Financials for this Owner
Home Financials are based on the most recent Mortgage that was taken out on this home.
Original Mortgage
$138,000
Interest Rate
6.78%
Purchase Details
Closed on
Nov 13, 1998
Sold by
Wilkins Theresa Tr Wilkins Family Trust
Bought by
Kane Sandra
Home Financials for this Owner
Home Financials are based on the most recent Mortgage that was taken out on this home.
Original Mortgage
$138,000
Interest Rate
6.78%
Purchase Details
Closed on
Oct 24, 1994
Sold by
Wilkins George O
Bought by
Wilkins George O and Wilkins Theresa
Create a Home Valuation Report for This Property
The Home Valuation Report is an in-depth analysis detailing your home's value as well as a comparison with similar homes in the area
Home Values in the Area
Average Home Value in this Area
Purchase History
| Date | Buyer | Sale Price | Title Company |
|---|---|---|---|
| Kane Sandra | -- | New Century Title | |
| Kane Sandra | -- | Chicago Title | |
| Kane Sandra | $158,000 | Chicago Title | |
| Wilkins George O | -- | -- |
Source: Public Records
Mortgage History
| Date | Status | Borrower | Loan Amount |
|---|---|---|---|
| Closed | Kane Sandra | $141,500 | |
| Closed | Kane Sandra | $138,000 |
Source: Public Records
Tax History
| Year | Tax Paid | Tax Assessment Tax Assessment Total Assessment is a certain percentage of the fair market value that is determined by local assessors to be the total taxable value of land and additions on the property. | Land | Improvement |
|---|---|---|---|---|
| 2025 | $3,210 | $247,672 | $148,448 | $99,224 |
| 2024 | $3,210 | $242,817 | $145,538 | $97,279 |
| 2023 | $3,135 | $238,057 | $142,685 | $95,372 |
| 2022 | $3,094 | $233,390 | $139,888 | $93,502 |
| 2021 | $3,044 | $228,815 | $137,146 | $91,669 |
| 2019 | $2,979 | $222,030 | $133,079 | $88,951 |
| 2018 | $2,814 | $217,677 | $130,470 | $87,207 |
| 2016 | $2,680 | $209,226 | $125,404 | $83,822 |
| 2015 | $2,665 | $206,084 | $123,521 | $82,563 |
| 2014 | $2,663 | $202,048 | $121,102 | $80,946 |
Source: Public Records
Map
Nearby Homes
- 922 E Edgecomb St
- 716 N Grand Ave Unit I-5
- 716 N Grand Ave Unit H3
- 716 N Grand Ave Unit A8
- 716 N Grand Ave Unit A-7
- 19548 E Cypress St Unit 3
- 19548 E Cypress St Unit 17
- 19548 E Cypress St
- 19548 E Cypress St Unit 33
- 905 N Bender Ave
- 19555 E Cypress St Unit P
- 445 N Mangrove Ave
- 544 E Rue Royale St
- 104 N Mangrove Ave
- 3614 N Grand Ave
- 1524 E Old Badillo St
- 1551 E Colver Place
- 565 E Benbow St
- 1355 E Level St
- 658 Calamansi Dr
- 1019 E Ruddock St
- 1037 E Ruddock St
- 1026 E Edgecomb St
- 1036 E Edgecomb St
- 1016 E Edgecomb St
- 1047 E Ruddock St
- 1009 E Ruddock St
- 359 N Bender Ave
- 1046 E Edgecomb St
- 1008 E Edgecomb St
- 358 N Bender Ave
- 1055 E Ruddock St
- 351 N Bender Ave
- 1056 E Edgecomb St
- 350 N Bender Ave
- 358 N Westridge Ave
- 359 N Dodsworth Ave
- 977 E Ruddock St
- 1065 E Ruddock St
- 1029 E Edgecomb St
Your Personal Tour Guide
Ask me questions while you tour the home.