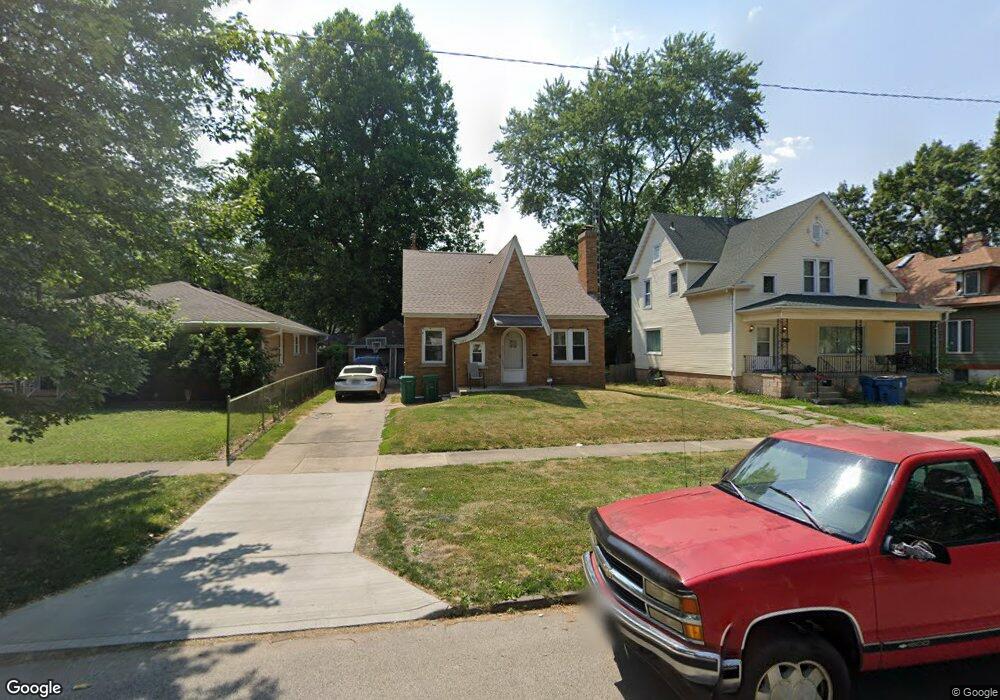
1029 N 8th St Springfield, IL 62702
Enos Park NeighborhoodEstimated Value: $105,000 - $145,000
3
Beds
2
Baths
1,808
Sq Ft
$67/Sq Ft
Est. Value
About This Home
This home is located at 1029 N 8th St, Springfield, IL 62702 and is currently estimated at $120,785, approximately $66 per square foot. 1029 N 8th St is a home located in Sangamon County with nearby schools including McClernand Elementary School, Washington Middle School, and Lanphier High School.
Ownership History
Date
Name
Owned For
Owner Type
Purchase Details
Closed on
Apr 16, 2018
Sold by
Dawn Gayton
Bought by
Gayton Dawn M and Gayton Anthony
Current Estimated Value
Home Financials for this Owner
Home Financials are based on the most recent Mortgage that was taken out on this home.
Original Mortgage
$68,563
Interest Rate
4.63%
Mortgage Type
FHA
Purchase Details
Closed on
Dec 3, 2009
Purchase Details
Closed on
Mar 25, 2008
Purchase Details
Closed on
May 7, 1997
Create a Home Valuation Report for This Property
The Home Valuation Report is an in-depth analysis detailing your home's value as well as a comparison with similar homes in the area
Home Values in the Area
Average Home Value in this Area
Purchase History
We collect this data history from publicly available records. To have your information removed, we recommend requesting removal directly through your county’s website.
| Date | Buyer | Sale Price | Title Company |
|---|---|---|---|
| Gayton Dawn M | -- | Meridian National Title | |
| -- | $80,000 | -- | |
| -- | $32,500 | -- | |
| -- | -- | -- |
Source: Public Records
Mortgage History
We collect this data history from publicly available records. To have your information removed, we recommend requesting removal directly through your county’s website.
| Date | Status | Borrower | Loan Amount |
|---|---|---|---|
| Previous Owner | Gayton Dawn M | $68,563 |
Source: Public Records
Tax History
| Year | Tax Paid | Tax Assessment Tax Assessment Total Assessment is a certain percentage of the fair market value that is determined by local assessors to be the total taxable value of land and additions on the property. | Land | Improvement |
|---|---|---|---|---|
| 2024 | $2,019 | $30,035 | $3,117 | $26,918 |
| 2023 | -- | $27,434 | $2,847 | $24,587 |
| 2022 | $0 | $25,603 | $2,701 | $22,902 |
| 2021 | $1,338 | $24,644 | $2,600 | $22,044 |
| 2020 | $1,338 | $24,681 | $2,604 | $22,077 |
| 2019 | $1,396 | $24,595 | $2,595 | $22,000 |
| 2018 | $1,338 | $24,333 | $2,582 | $21,751 |
| 2017 | $1,510 | $24,019 | $2,549 | $21,470 |
| 2016 | $1,474 | $23,669 | $2,512 | $21,157 |
| 2015 | $1,453 | $23,386 | $2,482 | $20,904 |
| 2014 | $1,428 | $23,235 | $2,466 | $20,769 |
| 2013 | $1,396 | $23,235 | $2,466 | $20,769 |
Source: Public Records
Map
Nearby Homes
- 1037 N 8th St
- 930 N 8th St
- 1059 N 6th St
- 1401 Enterprise St
- 1119 N 11th St
- 820 N 8th St
- 821 N 9th St
- 1215 N 5th St
- 1129 E Reservoir St
- 820 E Converse St
- 0 Buckhart Rd Unit RMACA1042585
- 0 Buckhart Rd Unit 26718059
- 1132 N 3rd St
- 1104 N 13th St
- 958 N 2nd St
- 1038 N 1st St
- 1521 E Matheny Ave
- 824 E Ridgely Ave
- 524 E Ridgely Ave Unit G, H, I, J, K & L
- 1617 E Matheny Ave
Your Personal Tour Guide
Ask me questions while you tour the home.