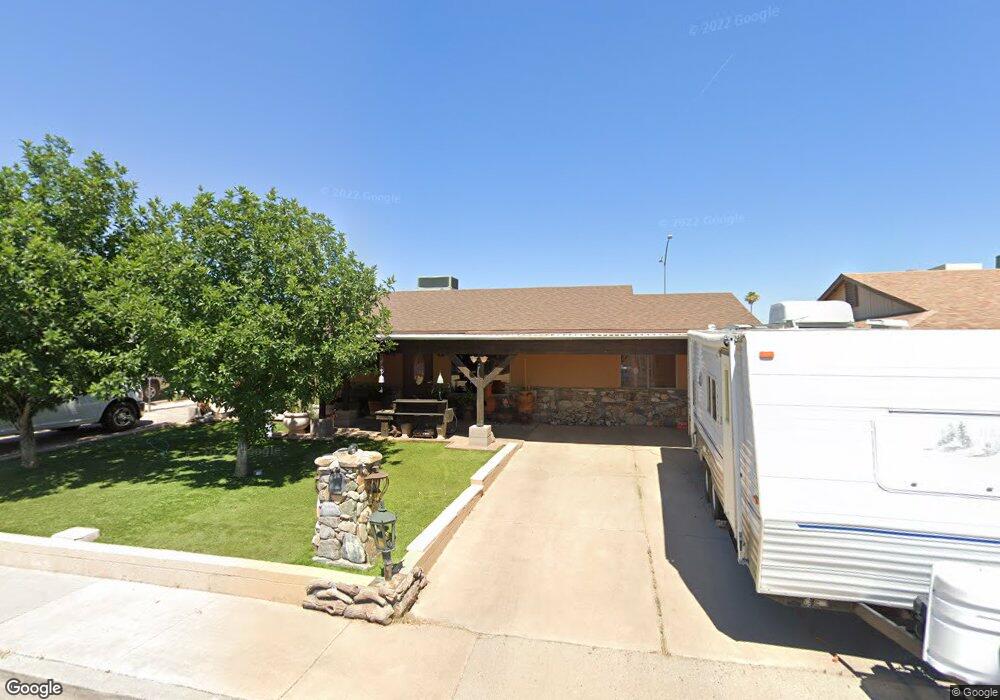
1029 S Kachina Mesa, AZ 85204
Reed Park NeighborhoodEstimated Value: $296,281 - $457,000
--
Bed
2
Baths
1,734
Sq Ft
$222/Sq Ft
Est. Value
About This Home
This home is located at 1029 S Kachina, Mesa, AZ 85204 and is currently estimated at $384,570, approximately $221 per square foot. 1029 S Kachina is a home located in Maricopa County with nearby schools including Lindbergh Elementary School, Franklin at Brimhall Elementary School, and Franklin West Elementary School.
Ownership History
Date
Name
Owned For
Owner Type
Purchase Details
Closed on
Sep 16, 2021
Sold by
Burns George L
Bought by
Burns George L and Burns Bailey
Current Estimated Value
Home Financials for this Owner
Home Financials are based on the most recent Mortgage that was taken out on this home.
Original Mortgage
$160,000
Outstanding Balance
$145,371
Interest Rate
2.7%
Mortgage Type
New Conventional
Estimated Equity
$239,199
Purchase Details
Closed on
May 16, 2002
Sold by
Aunchman Sandra Lee
Bought by
Aunchman Kenneth Scott
Purchase Details
Closed on
Jul 16, 1996
Sold by
Zeigler Bryan H and Zeigler Paula R
Bought by
Burns George L
Home Financials for this Owner
Home Financials are based on the most recent Mortgage that was taken out on this home.
Original Mortgage
$69,426
Interest Rate
8.39%
Mortgage Type
FHA
Create a Home Valuation Report for This Property
The Home Valuation Report is an in-depth analysis detailing your home's value as well as a comparison with similar homes in the area
Home Values in the Area
Average Home Value in this Area
Purchase History
| Date | Buyer | Sale Price | Title Company |
|---|---|---|---|
| Burns George L | -- | Driggs Title Agency Inc | |
| Aunchman Kenneth Scott | -- | -- | |
| Burns George L | $70,000 | Nations Title Insurance |
Source: Public Records
Mortgage History
| Date | Status | Borrower | Loan Amount |
|---|---|---|---|
| Open | Burns George L | $160,000 | |
| Previous Owner | Burns George L | $69,426 |
Source: Public Records
Tax History Compared to Growth
Tax History
| Year | Tax Paid | Tax Assessment Tax Assessment Total Assessment is a certain percentage of the fair market value that is determined by local assessors to be the total taxable value of land and additions on the property. | Land | Improvement |
|---|---|---|---|---|
| 2025 | $1,480 | $14,997 | -- | -- |
| 2024 | $1,484 | $14,283 | -- | -- |
| 2023 | $1,484 | $25,600 | $5,120 | $20,480 |
| 2022 | $1,231 | $19,660 | $3,930 | $15,730 |
| 2021 | $1,265 | $18,460 | $3,690 | $14,770 |
| 2020 | $1,248 | $16,550 | $3,310 | $13,240 |
| 2019 | $675 | $12,810 | $2,560 | $10,250 |
| 2018 | $644 | $11,660 | $2,330 | $9,330 |
| 2017 | $624 | $10,560 | $2,110 | $8,450 |
| 2016 | $613 | $9,070 | $1,810 | $7,260 |
| 2015 | $578 | $8,210 | $1,640 | $6,570 |
Source: Public Records
Map
Nearby Homes
- 908 S Kachina
- 2154 E Forge Ave
- 2210 E Forge Ave
- 2221 E Florian Ave
- 1752 E Gable Ave
- 2205 E Garnet Ave
- 1844 E Hampton Ave
- 1953 E Marilyn Ave
- 2226 E Diamond Ave
- 1927 E Hampton Ave Unit 263
- 1927 E Hampton Ave Unit 116
- 1927 E Hampton Ave Unit 260
- 2259 E Harmony Ave
- 1521 E Diamond Ave
- 1424 E El Moro Ave
- 2565 E Southern Ave Unit 139
- 2565 E Southern Ave Unit 3
- 943 S Lazona Dr
- 2245 E Capri Cir
- 749 S Lazona Dr
- 1023 S Kachina
- 1035 S Kachina
- 1041 S Kachina
- 1017 S Kachina
- 1022 S Kachina
- 1034 S Kachina
- 1016 S Kachina
- 1040 S Kachina
- 1049 S Kachina
- 1011 S Kachina
- 1046 S Kachina
- 1010 S Kachina
- 1027 S Cochise Cir
- 1033 S Cochise Cir
- 1003 S Kachina
- 1021 S Cochise Cir
- 1041 S Cochise Cir
- 1055 S Kachina
- 1004 S Kachina
- 1047 S Cochise Cir