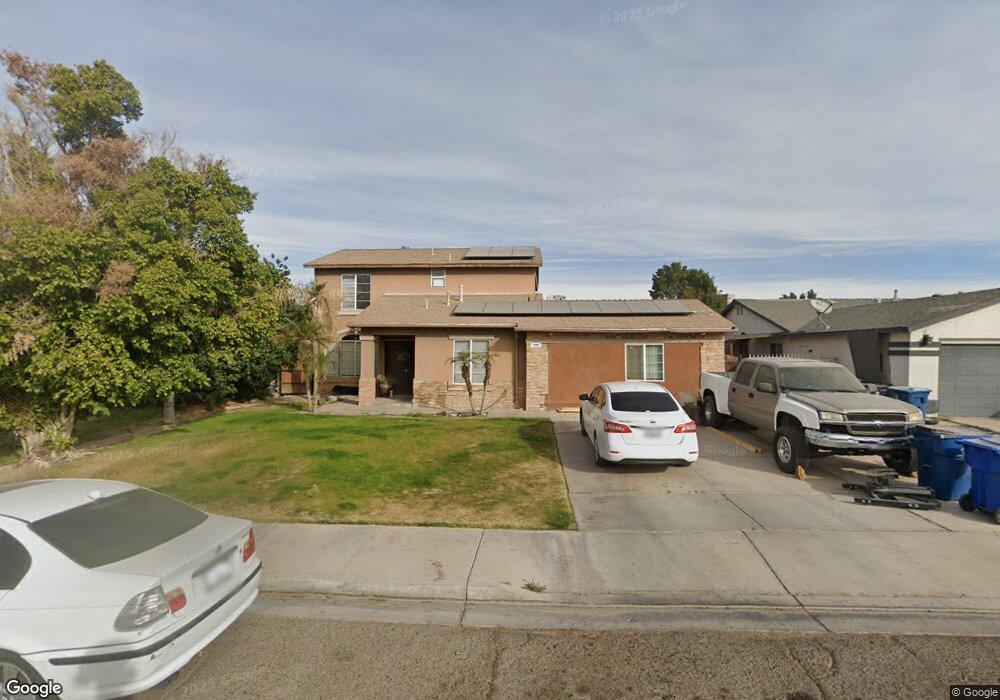
1029 Valley St Calexico, CA 92231
Estimated Value: $382,000 - $451,000
4
Beds
3
Baths
1,552
Sq Ft
$269/Sq Ft
Est. Value
About This Home
This home is located at 1029 Valley St, Calexico, CA 92231 and is currently estimated at $417,904, approximately $269 per square foot. 1029 Valley St is a home located in Imperial County with nearby schools including Blanche Charles Elementary School, William Moreno Junior High School, and Calexico High School.
Ownership History
Date
Name
Owned For
Owner Type
Purchase Details
Closed on
Dec 10, 2021
Sold by
Martin Delcampo Maria
Bought by
Delcampo Diane Martin and Perez Richard Araujo
Current Estimated Value
Home Financials for this Owner
Home Financials are based on the most recent Mortgage that was taken out on this home.
Original Mortgage
$216,222
Interest Rate
3.14%
Mortgage Type
New Conventional
Purchase Details
Closed on
Dec 6, 2021
Sold by
Martin Delcampo Diane
Bought by
Delcampo Diane Martin and Perez Richard Araujo
Home Financials for this Owner
Home Financials are based on the most recent Mortgage that was taken out on this home.
Original Mortgage
$216,222
Interest Rate
3.14%
Mortgage Type
New Conventional
Purchase Details
Closed on
Dec 4, 2002
Sold by
Delcampo Maria Martin
Bought by
Delcampo Diane Martin
Purchase Details
Closed on
Jul 3, 2001
Sold by
Delcampo Maria Martin
Bought by
Delcampo Maria Martin and Delcampo Diane Martin
Purchase Details
Closed on
Jul 30, 1997
Sold by
Lewis Homes Of Calif
Bought by
Delcampo Maria Martin
Home Financials for this Owner
Home Financials are based on the most recent Mortgage that was taken out on this home.
Original Mortgage
$98,057
Interest Rate
7.54%
Mortgage Type
FHA
Create a Home Valuation Report for This Property
The Home Valuation Report is an in-depth analysis detailing your home's value as well as a comparison with similar homes in the area
Purchase History
| Date | Buyer | Sale Price | Title Company |
|---|---|---|---|
| Delcampo Diane Martin | -- | Stewart Title | |
| Delcampo Diane Martin | -- | Stewart Title | |
| Delcampo Diane Martin | -- | Northern Counties Title | |
| Delcampo Maria Martin | -- | -- | |
| Delcampo Maria Martin | $113,000 | Chicago Title Co |
Source: Public Records
Mortgage History
| Date | Status | Borrower | Loan Amount |
|---|---|---|---|
| Closed | Delcampo Diane Martin | $216,222 | |
| Closed | Delcampo Diane Martin | $216,222 | |
| Previous Owner | Delcampo Maria Martin | $98,057 |
Source: Public Records
Tax History
| Year | Tax Paid | Tax Assessment Tax Assessment Total Assessment is a certain percentage of the fair market value that is determined by local assessors to be the total taxable value of land and additions on the property. | Land | Improvement |
|---|---|---|---|---|
| 2025 | $3,865 | $318,361 | $74,284 | $244,077 |
| 2023 | $3,865 | $306,000 | $71,400 | $234,600 |
| 2022 | $3,743 | $204,788 | $35,758 | $169,030 |
| 2021 | $2,140 | $173,051 | $31,011 | $142,040 |
| 2020 | $2,061 | $171,278 | $30,694 | $140,584 |
| 2019 | $2,002 | $167,921 | $30,093 | $137,828 |
| 2018 | $1,984 | $164,629 | $29,503 | $135,126 |
| 2017 | $1,840 | $161,402 | $28,925 | $132,477 |
| 2016 | $1,755 | $158,238 | $28,358 | $129,880 |
| 2015 | $1,725 | $155,863 | $27,933 | $127,930 |
| 2014 | $1,370 | $124,160 | $35,000 | $89,160 |
Source: Public Records
Map
Nearby Homes
- 1012 Desert View St
- 1049 Horizon St
- 956 Salvador Guilin St
- 904 Salvador Guilin St
- 1324 River Dr
- 936 Nosotros St
- 920 Brandenburg Ct
- 1040 Grant St
- 530 W Birch St
- 937 Lacy Ave
- 0 Hwy 98 and Andrade Ave Unit PTP2507850
- 0 Sec Carr Rd & Rood Rd Unit 24358721IC
- 0 Beech Canal Gate 15 Unit 24368695IC
- 652 Lincoln St
- 684 Emilia Dr
- 1119 Imperial Ave W
- 38 Las Flores Dr
- 105 John Kennedy St
- 0 W Anza Rd Unit 26646559IC
- 21 E 7th St
- 1033 Valley St
- 1025 Valley St
- 1172 Rainbow Ave
- 1021 Valley St
- 1024 Sunset St
- 1037 Valley St
- 1178 Rainbow Ave
- 1020 Sunset St
- 1028 Valley St
- 1032 Valley St
- 1024 Valley St
- 1017 Valley St
- 1036 Valley St
- 1020 Valley St
- 1016 Sunset St
- 1156 Rainbow Ave
- 1013 Valley St
- 1016 Valley St
- 1012 Sunset St
- 1169 Rainbow Ave
Your Personal Tour Guide
Ask me questions while you tour the home.