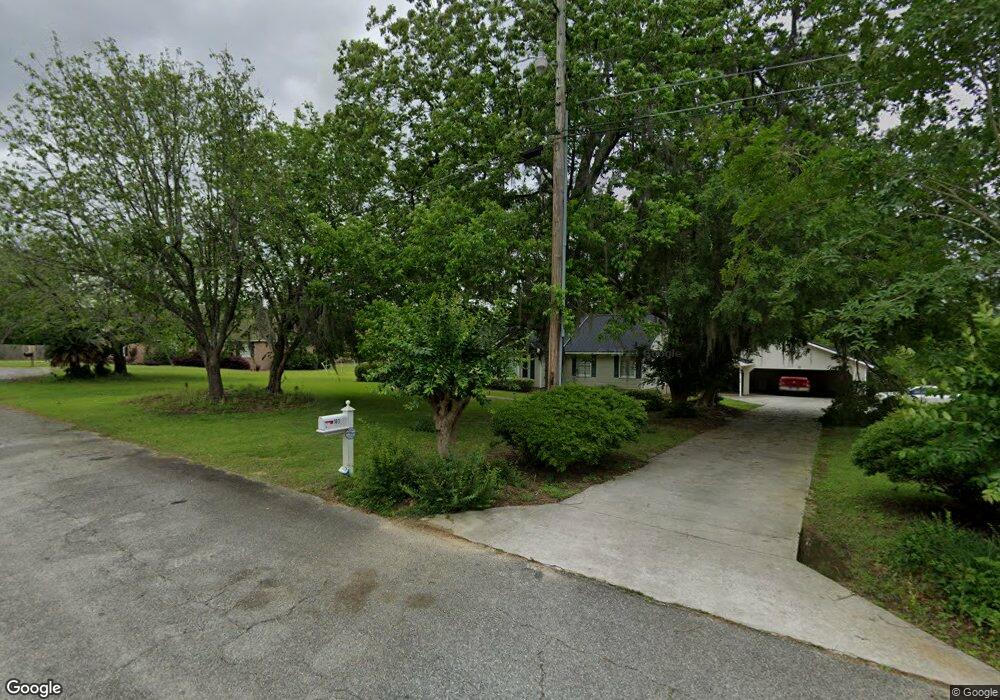
103 Camellia Dr Quitman, GA 31643
Estimated Value: $239,000 - $269,000
3
Beds
2
Baths
2,582
Sq Ft
$99/Sq Ft
Est. Value
About This Home
This home is located at 103 Camellia Dr, Quitman, GA 31643 and is currently estimated at $254,725, approximately $98 per square foot. 103 Camellia Dr is a home located in Brooks County with nearby schools including Quitman Elementary School and First Baptist Church Preschool & Kindergarten.
Ownership History
Date
Name
Owned For
Owner Type
Purchase Details
Closed on
Aug 7, 2020
Sold by
Powell Alfred J
Bought by
Mccloud Kendrick D and Mccloud Whitney E
Current Estimated Value
Home Financials for this Owner
Home Financials are based on the most recent Mortgage that was taken out on this home.
Original Mortgage
$139,500
Interest Rate
3%
Mortgage Type
New Conventional
Purchase Details
Closed on
Apr 15, 1999
Sold by
West Ginger
Bought by
Powell Powell A and Powell J
Purchase Details
Closed on
Oct 2, 1991
Sold by
West West H and West Ginger
Bought by
West Ginger
Purchase Details
Closed on
Jun 2, 1989
Sold by
West Inc & Grady Williams
Bought by
West West H and West Ginger
Purchase Details
Closed on
Dec 9, 1986
Sold by
West Inc & Grady Williams
Bought by
West West H and West Ginger
Purchase Details
Closed on
Oct 15, 1986
Sold by
West Inc
Bought by
West Inc & Grady Williams
Create a Home Valuation Report for This Property
The Home Valuation Report is an in-depth analysis detailing your home's value as well as a comparison with similar homes in the area
Home Values in the Area
Average Home Value in this Area
Purchase History
| Date | Buyer | Sale Price | Title Company |
|---|---|---|---|
| Mccloud Kendrick D | $155,000 | -- | |
| Powell Powell A | $110,000 | -- | |
| West Ginger | -- | -- | |
| West West H | -- | -- | |
| West West H | $5,000 | -- | |
| West Inc & Grady Williams | $18,000 | -- |
Source: Public Records
Mortgage History
| Date | Status | Borrower | Loan Amount |
|---|---|---|---|
| Closed | Mccloud Kendrick D | $139,500 |
Source: Public Records
Tax History Compared to Growth
Tax History
| Year | Tax Paid | Tax Assessment Tax Assessment Total Assessment is a certain percentage of the fair market value that is determined by local assessors to be the total taxable value of land and additions on the property. | Land | Improvement |
|---|---|---|---|---|
| 2024 | $3,356 | $102,560 | $9,000 | $93,560 |
| 2023 | $3,115 | $95,200 | $9,000 | $86,200 |
| 2022 | $2,602 | $73,520 | $8,800 | $64,720 |
| 2021 | $2,234 | $69,280 | $8,800 | $60,480 |
| 2020 | $2,443 | $69,280 | $8,800 | $60,480 |
| 2019 | $1,703 | $62,840 | $8,520 | $54,320 |
| 2018 | $2,285 | $62,840 | $8,520 | $54,320 |
| 2017 | $1,668 | $60,960 | $9,000 | $51,960 |
| 2016 | $1,651 | $60,960 | $9,000 | $51,960 |
| 2015 | -- | $60,440 | $9,000 | $51,440 |
| 2014 | -- | $61,160 | $9,000 | $52,160 |
| 2013 | -- | $61,160 | $9,000 | $52,160 |
Source: Public Records
Map
Nearby Homes
- 2434 Dunn Rd
- 309 Eastlake Dr
- 804 Westlake Dr
- 1103 W Railroad St
- 802 W Lafayette St
- 602 N Webster St
- 1540 Dunn Rd
- 304 W Rountree St
- 606 N Court St
- 503 N Culpepper St
- 621 N Court St
- 1002 N Madison St
- 5616 Empress Rd
- 000 E Gordon St
- 714 Morris Ave
- 302 Waterside Dr
- 1306 E Screven St
- 84 W Us
- 7747 Empress Rd
- 5036 Hamlin Rd
- 107 Magnolia Dr
- 101 Camellia Dr
- 103 Magnolia Dr
- 105 Camellia Dr
- 106 Camellia Dr
- 101 Magnolia Dr
- 102 Camellia Dr
- 108 Camellia Dr
- 113 Magnolia Dr
- 2410 Dunn Rd
- 104 Magnolia Dr
- 115 Magnolia Dr
- 203 Camellia Dr
- 102 Magnolia Dr
- 1703 Azalea Dr
- 2364 Dunn Rd
- 205 Camellia Dr
- 201 Plantation Dr
- 103 Plantation Dr
- 203 Plantation Dr