Estimated Value: $136,000 - $196,000
4
Beds
2
Baths
1,742
Sq Ft
$95/Sq Ft
Est. Value
About This Home
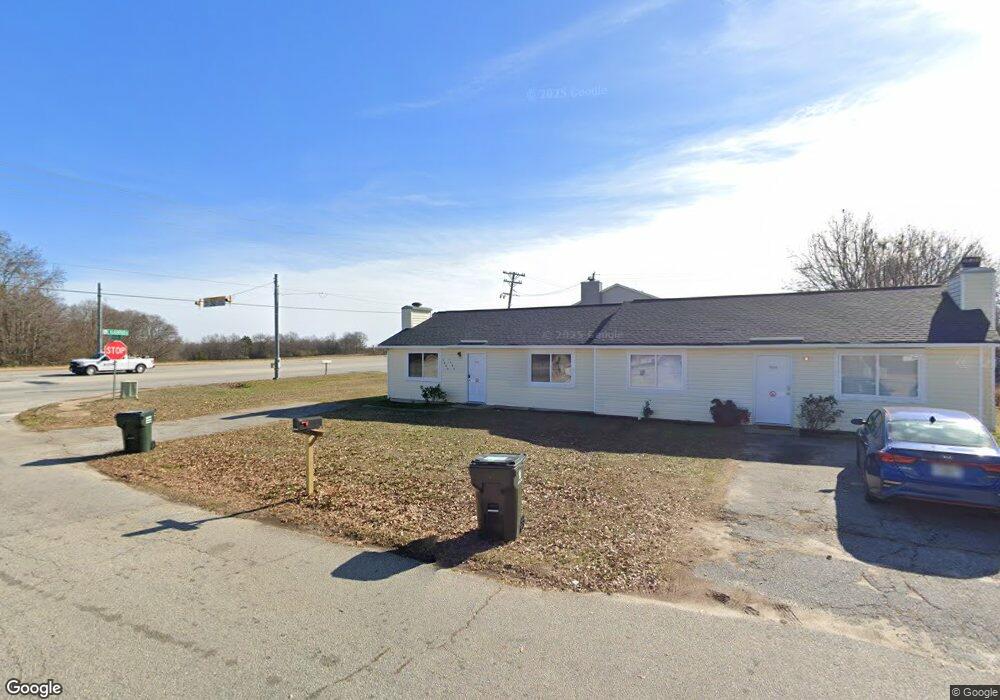
This home is located at 103 Chelsea St Unit A, Moore, SC 29369 and is currently estimated at $165,674, approximately $95 per square foot. 103 Chelsea St Unit A is a home located in Spartanburg County with nearby schools including Dorman High School Freshman Campus, Dorman High School, and Fine Arts Preparatory School.
Ownership History
Date
Name
Owned For
Owner Type
Purchase Details
Closed on
Sep 7, 2020
Sold by
The Chelsea Trust
Bought by
Rodger C Jarrell Re & Nortgages Inc
Current Estimated Value
Home Financials for this Owner
Home Financials are based on the most recent Mortgage that was taken out on this home.
Original Mortgage
$53,589
Outstanding Balance
$47,406
Interest Rate
2.73%
Mortgage Type
Land Contract Argmt. Of Sale
Estimated Equity
$118,268
Purchase Details
Closed on
Oct 30, 2019
Sold by
Rodger C Jarrell Re & Mortgages Inc
Bought by
Cantrell Kendra D
Home Financials for this Owner
Home Financials are based on the most recent Mortgage that was taken out on this home.
Original Mortgage
$95,900
Outstanding Balance
$82,396
Interest Rate
2.6%
Mortgage Type
Land Contract Argmt. Of Sale
Estimated Equity
$83,278
Purchase Details
Closed on
Dec 4, 2003
Sold by
Gage Brandon Adam
Bought by
The Chelsea Trust
Purchase Details
Closed on
Nov 4, 2003
Sold by
Funk Dennis L
Bought by
Gage Brandon Adam
Create a Home Valuation Report for This Property
The Home Valuation Report is an in-depth analysis detailing your home's value as well as a comparison with similar homes in the area
Home Values in the Area
Average Home Value in this Area
Purchase History
| Date | Buyer | Sale Price | Title Company |
|---|---|---|---|
| Rodger C Jarrell Re & Nortgages Inc | $65,539 | None Available | |
| Cantrell Kendra D | $95,900 | None Available | |
| The Chelsea Trust | -- | -- | |
| Gage Brandon Adam | $65,000 | -- |
Source: Public Records
Mortgage History
| Date | Status | Borrower | Loan Amount |
|---|---|---|---|
| Open | Rodger C Jarrell Re & Nortgages Inc | $53,589 | |
| Open | Cantrell Kendra D | $95,900 |
Source: Public Records
Tax History Compared to Growth
Tax History
| Year | Tax Paid | Tax Assessment Tax Assessment Total Assessment is a certain percentage of the fair market value that is determined by local assessors to be the total taxable value of land and additions on the property. | Land | Improvement |
|---|---|---|---|---|
| 2025 | $2,136 | $5,555 | $892 | $4,663 |
| 2024 | $2,136 | $5,555 | $892 | $4,663 |
| 2023 | $2,136 | $5,555 | $892 | $4,663 |
| 2022 | $1,947 | $4,830 | $753 | $4,077 |
| 2021 | $1,928 | $4,830 | $753 | $4,077 |
| 2020 | $1,954 | $4,830 | $753 | $4,077 |
| 2019 | $1,930 | $4,830 | $753 | $4,077 |
| 2018 | $1,933 | $4,830 | $753 | $4,077 |
| 2017 | $1,665 | $4,200 | $636 | $3,564 |
| 2016 | $1,668 | $4,200 | $636 | $3,564 |
| 2015 | $1,588 | $4,080 | $516 | $3,564 |
| 2014 | $1,546 | $4,080 | $516 | $3,564 |
Source: Public Records
Map
Nearby Homes
- 2160 Davenport Ct
- 2201 Davenport Ct
- 2209 Davenport Ct
- 111 Linville Dr
- 2208 Davenport Ct
- ATWOOD Plan at Hampshire Heights
- HUNTINGTON Plan at Hampshire Heights
- JOSIE Plan at Hampshire Heights
- GIBSON Plan at Hampshire Heights
- 2224 Davenport Ct
- 2011 Lachaise Ln
- 2601 Karkinnen Way
- Reynolds Plan at Hampshire Heights
- Bishop Plan at Hampshire Heights
- Wellford Plan at Hampshire Heights
- Clifton Plan at Hampshire Heights
- Pacific Plan at Hampshire Heights
- Quincy Plan at Hampshire Heights
- Inman Plan at Hampshire Heights
- Heatherwood Plan at Hampshire Heights
- 103 Chelsea St
- 1286 E Blackstock Rd Unit 1288
- 109 Chelsea St
- 109 Chelsea St
- 113 Chelsea St
- 1130 E Blackstock Rd
- 112 Chelsea St
- 115 Chelsea St
- 1126 E Blackstock Rd
- 114 Chelsea St
- 117 Chelsea St
- 103 Old Farm Rd
- 103 Old Farm Rd
- 116 Chelsea St
- 1122 E Blackstock Rd
- 119 Chelsea St
- 101 Old Farm Rd
- 118 Chelsea St
- 105 Old Farm Rd
- 121 Chelsea St