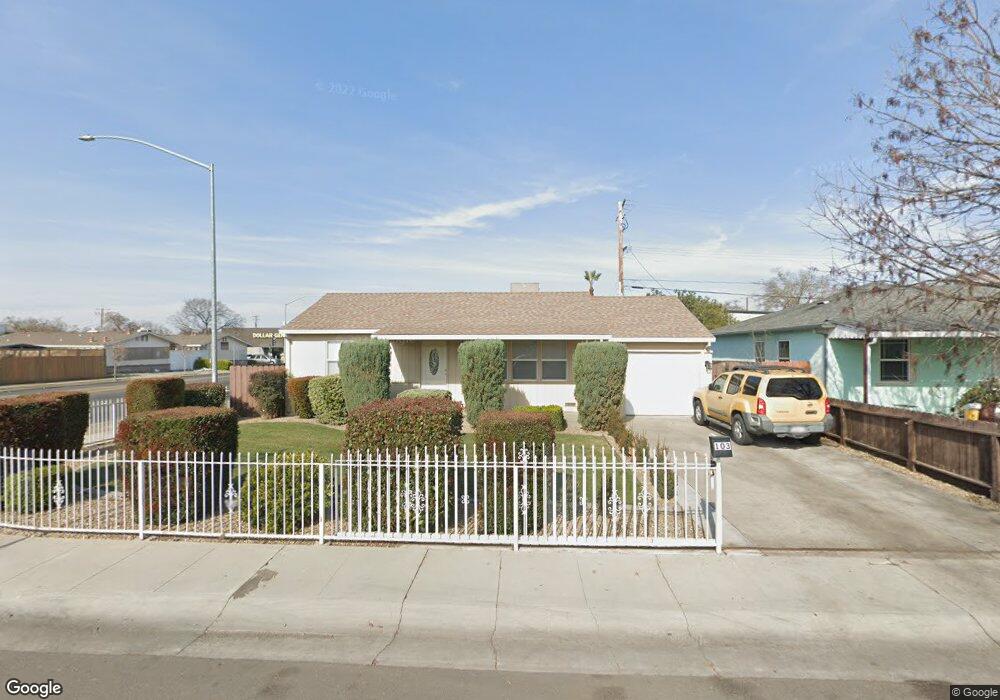
103 E Barrymore St Stockton, CA 95204
Midtown NeighborhoodEstimated Value: $290,000 - $345,000
2
Beds
1
Bath
852
Sq Ft
$383/Sq Ft
Est. Value
About This Home
This home is located at 103 E Barrymore St, Stockton, CA 95204 and is currently estimated at $326,468, approximately $383 per square foot. 103 E Barrymore St is a home located in San Joaquin County with nearby schools including Cleveland Elementary School, Wilson Elementary School, and El Dorado Elementary School.
Ownership History
Date
Name
Owned For
Owner Type
Purchase Details
Closed on
Sep 29, 2014
Sold by
Hamed Kamal Ismail
Bought by
Brand Living Trust and Brand Lelia M
Current Estimated Value
Purchase Details
Closed on
Dec 22, 2005
Sold by
Brand Ricky L and Brand Leila M
Bought by
Hamed Kamal Ismail
Home Financials for this Owner
Home Financials are based on the most recent Mortgage that was taken out on this home.
Original Mortgage
$210,000
Interest Rate
6.36%
Mortgage Type
Seller Take Back
Purchase Details
Closed on
Jun 21, 2000
Sold by
Simas Edward A
Bought by
Brand Ricky L and Brand Leila M
Home Financials for this Owner
Home Financials are based on the most recent Mortgage that was taken out on this home.
Original Mortgage
$72,500
Interest Rate
8.67%
Mortgage Type
Seller Take Back
Purchase Details
Closed on
Dec 10, 1998
Sold by
Simas Sharon K
Bought by
Simas Edward A
Create a Home Valuation Report for This Property
The Home Valuation Report is an in-depth analysis detailing your home's value as well as a comparison with similar homes in the area
Home Values in the Area
Average Home Value in this Area
Purchase History
| Date | Buyer | Sale Price | Title Company |
|---|---|---|---|
| Brand Living Trust | -- | Old Republic Title Company | |
| Hamed Kamal Ismail | $210,000 | Chicago Title Co | |
| Brand Ricky L | $72,500 | Chicago Title Co | |
| Simas Edward A | -- | -- |
Source: Public Records
Mortgage History
| Date | Status | Borrower | Loan Amount |
|---|---|---|---|
| Previous Owner | Hamed Kamal Ismail | $210,000 | |
| Previous Owner | Brand Ricky L | $72,500 |
Source: Public Records
Tax History
| Year | Tax Paid | Tax Assessment Tax Assessment Total Assessment is a certain percentage of the fair market value that is determined by local assessors to be the total taxable value of land and additions on the property. | Land | Improvement |
|---|---|---|---|---|
| 2025 | $2,173 | $173,057 | $51,675 | $121,382 |
| 2024 | $2,138 | $169,664 | $50,662 | $119,002 |
| 2023 | $2,090 | $166,338 | $49,669 | $116,669 |
| 2022 | $2,043 | $163,078 | $48,696 | $114,382 |
| 2021 | $1,963 | $159,882 | $47,742 | $112,140 |
| 2020 | $2,001 | $158,244 | $47,253 | $110,991 |
| 2019 | $1,993 | $155,142 | $46,327 | $108,815 |
| 2018 | $1,957 | $152,101 | $45,419 | $106,682 |
| 2017 | $1,854 | $149,120 | $44,529 | $104,591 |
| 2016 | $1,888 | $146,196 | $43,656 | $102,540 |
| 2015 | $1,835 | $140,000 | $48,000 | $92,000 |
| 2014 | $1,406 | $117,000 | $35,000 | $82,000 |
Source: Public Records
Map
Nearby Homes
- 32 E Mckenzie Ave
- 6 W Fargo St
- 235 E Knoles Way
- 4119 N Commerce St
- 40 E Harper St
- 3427 N Hunter St
- 39 W Ingram St
- 321 E Euclid Ave
- 3978 N American St
- 328 Northbank Ct Unit 79
- 44 W Alpine Ave
- 4452 Cotton Ct
- 4332 Pacific Ave Unit 64
- 4332 Pacific Ave Unit 25
- 3227 Bonnie Ln
- 719 Beeler St
- 4467 Dorset St
- 428 Caribrook Way Unit 2
- 122 E Monterey Ave
- 440 Caribrook Way Unit 1
- 111 E Barrymore St
- 4020 N El Dorado St
- 121 E Barrymore St
- 67 E Barrymore St
- 104 E Barrymore St
- 112 E Barrymore St
- 131 E Barrymore St
- 116 E Churchill St
- 122 E Barrymore St
- 57 E Barrymore St
- 68 E Barrymore St
- 4049 N El Dorado St
- 139 Barrymore St E
- 139 E Barrymore St
- 132 E Barrymore St
- 124 E Churchill St Unit 5
- 58 E Barrymore St
- 49 E Barrymore St
- 103 E Atlee St
- 111 E Atlee St Unit 2
Your Personal Tour Guide
Ask me questions while you tour the home.