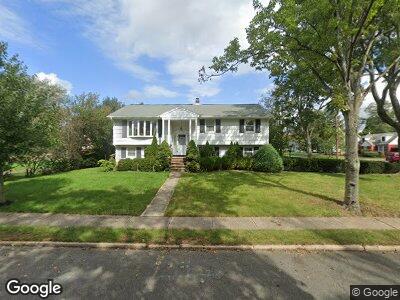
103 Legion Place Paramus, NJ 07652
Estimated Value: $782,000 - $867,000
--
Bed
--
Bath
2,082
Sq Ft
$402/Sq Ft
Est. Value
About This Home
This home is located at 103 Legion Place, Paramus, NJ 07652 and is currently estimated at $836,503, approximately $401 per square foot. 103 Legion Place is a home located in Bergen County with nearby schools including Paramus High School and Alpine Learning Group.
Ownership History
Date
Name
Owned For
Owner Type
Purchase Details
Closed on
May 8, 2002
Sold by
Camaj Frank
Bought by
Kim Do K and Kim Hwa J
Current Estimated Value
Home Financials for this Owner
Home Financials are based on the most recent Mortgage that was taken out on this home.
Original Mortgage
$339,000
Interest Rate
6.92%
Purchase Details
Closed on
Sep 21, 2000
Bought by
Camaj Violet
Home Financials for this Owner
Home Financials are based on the most recent Mortgage that was taken out on this home.
Original Mortgage
$9,179
Interest Rate
7.78%
Purchase Details
Closed on
May 1, 1998
Sold by
Jankowski John
Bought by
Camaj Fran and Camaj Violet
Home Financials for this Owner
Home Financials are based on the most recent Mortgage that was taken out on this home.
Original Mortgage
$162,000
Interest Rate
7.04%
Create a Home Valuation Report for This Property
The Home Valuation Report is an in-depth analysis detailing your home's value as well as a comparison with similar homes in the area
Home Values in the Area
Average Home Value in this Area
Purchase History
| Date | Buyer | Sale Price | Title Company |
|---|---|---|---|
| Kim Do K | $452,000 | -- | |
| Camaj Violet | -- | -- | |
| Camaj Violet | -- | -- | |
| Camaj Fran | $262,000 | -- |
Source: Public Records
Mortgage History
| Date | Status | Borrower | Loan Amount |
|---|---|---|---|
| Open | Kim Hwajung | $135,000 | |
| Closed | Kim Do Kyun | $134,336 | |
| Open | Kim Hwajung | $210,000 | |
| Previous Owner | Kim Do K | $339,000 | |
| Previous Owner | Camaj Violet | $9,179 | |
| Previous Owner | Camaj Fran | $162,000 | |
| Previous Owner | Camaj Fran | $162,000 |
Source: Public Records
Tax History Compared to Growth
Tax History
| Year | Tax Paid | Tax Assessment Tax Assessment Total Assessment is a certain percentage of the fair market value that is determined by local assessors to be the total taxable value of land and additions on the property. | Land | Improvement |
|---|---|---|---|---|
| 2024 | $9,043 | $615,400 | $342,100 | $273,300 |
| 2023 | $8,565 | $589,500 | $325,400 | $264,100 |
| 2022 | $8,565 | $551,900 | $302,800 | $249,100 |
| 2021 | $8,421 | $509,100 | $279,400 | $229,700 |
| 2020 | $7,997 | $501,400 | $274,400 | $227,000 |
| 2019 | $8,911 | $480,100 | $244,800 | $235,300 |
| 2018 | $8,800 | $480,100 | $244,800 | $235,300 |
| 2017 | $8,647 | $480,100 | $244,800 | $235,300 |
| 2016 | $8,411 | $480,100 | $244,800 | $235,300 |
| 2015 | $8,325 | $480,100 | $244,800 | $235,300 |
| 2014 | $8,253 | $480,100 | $244,800 | $235,300 |
Source: Public Records
Map
Nearby Homes
- 642 Falmouth Ave
- 123 Somerville Rd
- 170 Reid Way
- 741 Linwood Ave
- 653 Linden St
- 590 Grist Trail
- 709 Albert Place
- 574 Mill Run
- 3 Churchill Ct
- 562 Beech Ln
- 611 Albert Place
- 777 E Ridgewood Ave
- 35 E Ridgewood Ave
- 31 Reynen Ct
- 1153 Linwood Ave
- 792 Kearney Place
- 302 Walthery Ave
- 263 Standish Rd
- 332 Jefferson St
- 615 Shelton Rd