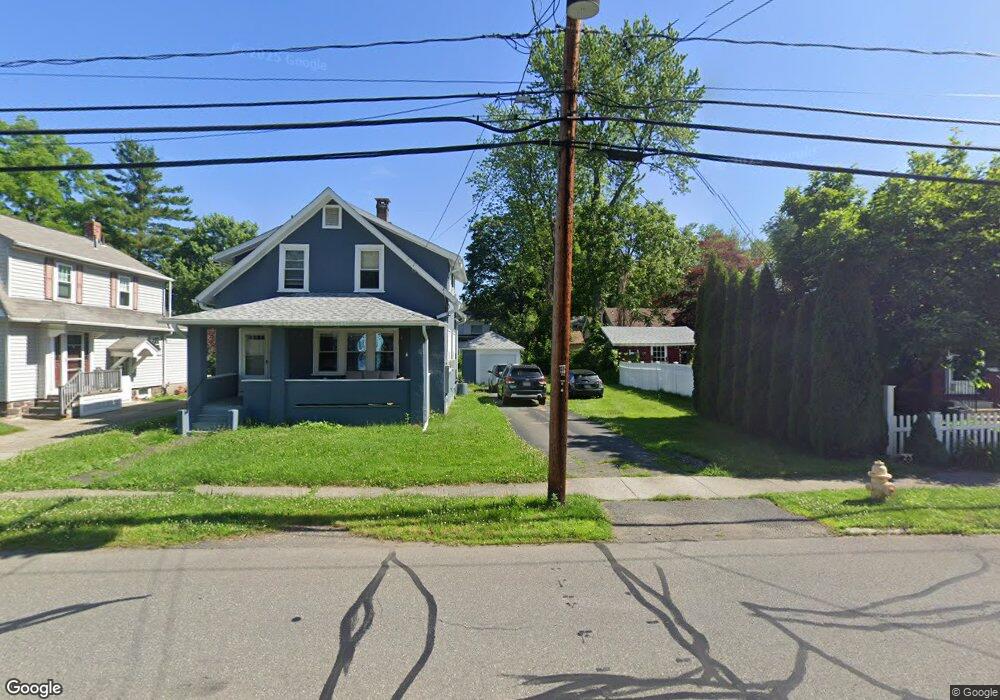
103 Maple St Greenfield, MA 01301
Estimated Value: $230,000 - $285,007
3
Beds
1
Bath
1,094
Sq Ft
$242/Sq Ft
Est. Value
About This Home
This home is located at 103 Maple St, Greenfield, MA 01301 and is currently estimated at $265,252, approximately $242 per square foot. 103 Maple St is a home located in Franklin County with nearby schools including Holy Trinity School and Cornerstone Christian School.
Ownership History
Date
Name
Owned For
Owner Type
Purchase Details
Closed on
Jul 12, 2023
Sold by
Scoble Deborah A and Greenfield Coop Bank
Bought by
Benegan 2 Llc
Current Estimated Value
Purchase Details
Closed on
Aug 24, 2001
Sold by
Radebaughdebo Judith A
Bought by
Scoble Deborah A
Home Financials for this Owner
Home Financials are based on the most recent Mortgage that was taken out on this home.
Original Mortgage
$78,280
Interest Rate
7.21%
Mortgage Type
Purchase Money Mortgage
Create a Home Valuation Report for This Property
The Home Valuation Report is an in-depth analysis detailing your home's value as well as a comparison with similar homes in the area
Home Values in the Area
Average Home Value in this Area
Purchase History
| Date | Buyer | Sale Price | Title Company |
|---|---|---|---|
| Benegan 2 Llc | $121,000 | None Available | |
| Benegan 2 Llc | $121,000 | None Available | |
| Scoble Deborah A | $97,850 | -- | |
| Scoble Deborah A | $97,850 | -- |
Source: Public Records
Mortgage History
| Date | Status | Borrower | Loan Amount |
|---|---|---|---|
| Previous Owner | Scoble Deborah A | $78,280 | |
| Previous Owner | Scoble Deborah A | $51,300 |
Source: Public Records
Tax History Compared to Growth
Tax History
| Year | Tax Paid | Tax Assessment Tax Assessment Total Assessment is a certain percentage of the fair market value that is determined by local assessors to be the total taxable value of land and additions on the property. | Land | Improvement |
|---|---|---|---|---|
| 2025 | $4,145 | $211,900 | $68,600 | $143,300 |
| 2024 | $4,054 | $198,800 | $56,500 | $142,300 |
| 2023 | $3,677 | $187,100 | $56,500 | $130,600 |
| 2022 | $3,616 | $162,000 | $53,800 | $108,200 |
| 2021 | $3,509 | $151,100 | $53,800 | $97,300 |
| 2020 | $3,382 | $147,500 | $53,800 | $93,700 |
| 2019 | $3,142 | $140,500 | $46,800 | $93,700 |
| 2018 | $3,086 | $137,600 | $45,800 | $91,800 |
| 2017 | $2,990 | $137,600 | $45,800 | $91,800 |
| 2016 | $3,038 | $139,300 | $48,500 | $90,800 |
| 2015 | $2,974 | $132,100 | $48,500 | $83,600 |
| 2014 | $2,714 | $132,200 | $48,500 | $83,700 |
Source: Public Records
Map
Nearby Homes