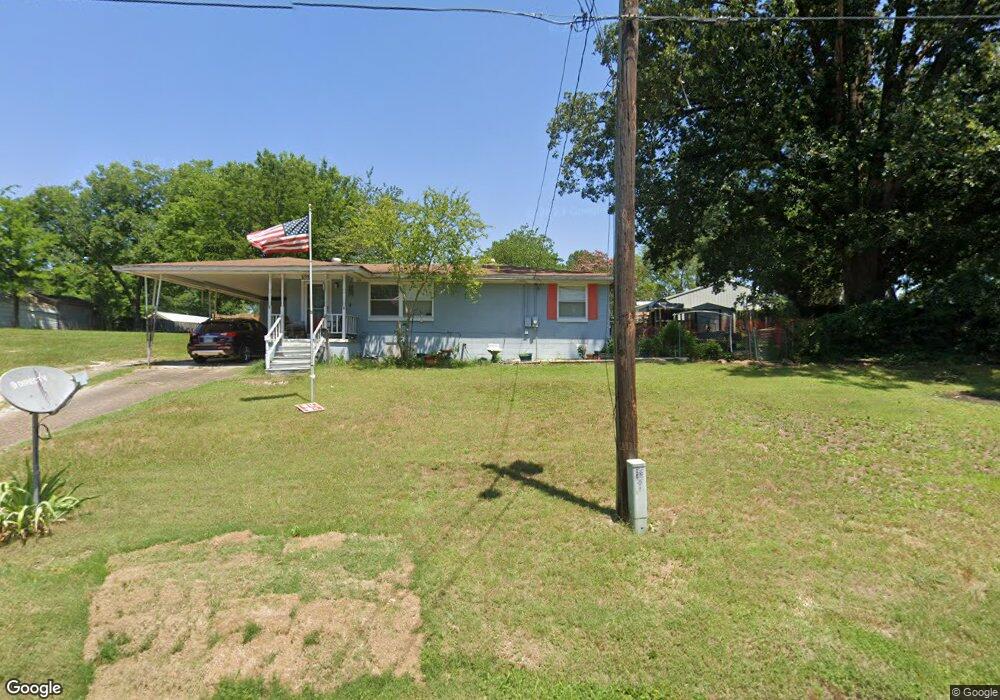
103 S 3rd St Benton, AR 72015
Estimated Value: $87,079 - $180,000
Studio
1
Bath
1,120
Sq Ft
$121/Sq Ft
Est. Value
About This Home
This home is located at 103 S 3rd St, Benton, AR 72015 and is currently estimated at $135,270, approximately $120 per square foot. 103 S 3rd St is a home located in Saline County with nearby schools including Angie Grant Elementary School, Benton Middle School, and Benton Junior High School.
Ownership History
Date
Name
Owned For
Owner Type
Purchase Details
Closed on
Oct 14, 2004
Bought by
Hawkins
Current Estimated Value
Purchase Details
Closed on
Sep 23, 2004
Bought by
Hawkins
Purchase Details
Closed on
Aug 23, 2004
Bought by
Pmd Prop
Purchase Details
Closed on
Aug 18, 2004
Bought by
Pmd Prop
Purchase Details
Closed on
Mar 11, 1994
Bought by
Barlow - Adding Baxley
Purchase Details
Closed on
Feb 3, 1994
Bought by
Barlow
Purchase Details
Closed on
Oct 19, 1993
Bought by
Hud
Purchase Details
Closed on
Sep 20, 1993
Bought by
Bsl
Create a Home Valuation Report for This Property
The Home Valuation Report is an in-depth analysis detailing your home's value as well as a comparison with similar homes in the area
Home Values in the Area
Average Home Value in this Area
Purchase History
| Date | Buyer | Sale Price | Title Company |
|---|---|---|---|
| Hawkins | $42,000 | -- | |
| Hawkins | $42,000 | -- | |
| Pmd Prop | $137,000 | -- | |
| Pmd Prop | $137,000 | -- | |
| Barlow - Adding Baxley | -- | -- | |
| Barlow | -- | -- | |
| Hud | -- | -- | |
| Bsl | -- | -- |
Source: Public Records
Tax History
| Year | Tax Paid | Tax Assessment Tax Assessment Total Assessment is a certain percentage of the fair market value that is determined by local assessors to be the total taxable value of land and additions on the property. | Land | Improvement |
|---|---|---|---|---|
| 2025 | $628 | $17,386 | $2,400 | $14,986 |
| 2024 | $643 | $17,386 | $2,400 | $14,986 |
| 2023 | $203 | $17,386 | $2,400 | $14,986 |
| 2022 | $253 | $17,386 | $2,400 | $14,986 |
| 2021 | $253 | $11,340 | $1,200 | $10,140 |
| 2020 | $253 | $11,340 | $1,200 | $10,140 |
| 2019 | $253 | $11,340 | $1,200 | $10,140 |
| 2018 | $277 | $11,340 | $1,200 | $10,140 |
| 2017 | $277 | $11,340 | $1,200 | $10,140 |
| 2016 | $645 | $12,430 | $1,200 | $11,230 |
| 2015 | $283 | $12,430 | $1,200 | $11,230 |
| 2014 | $261 | $10,430 | $1,200 | $9,230 |
Source: Public Records
Map
Nearby Homes
Your Personal Tour Guide
Ask me questions while you tour the home.