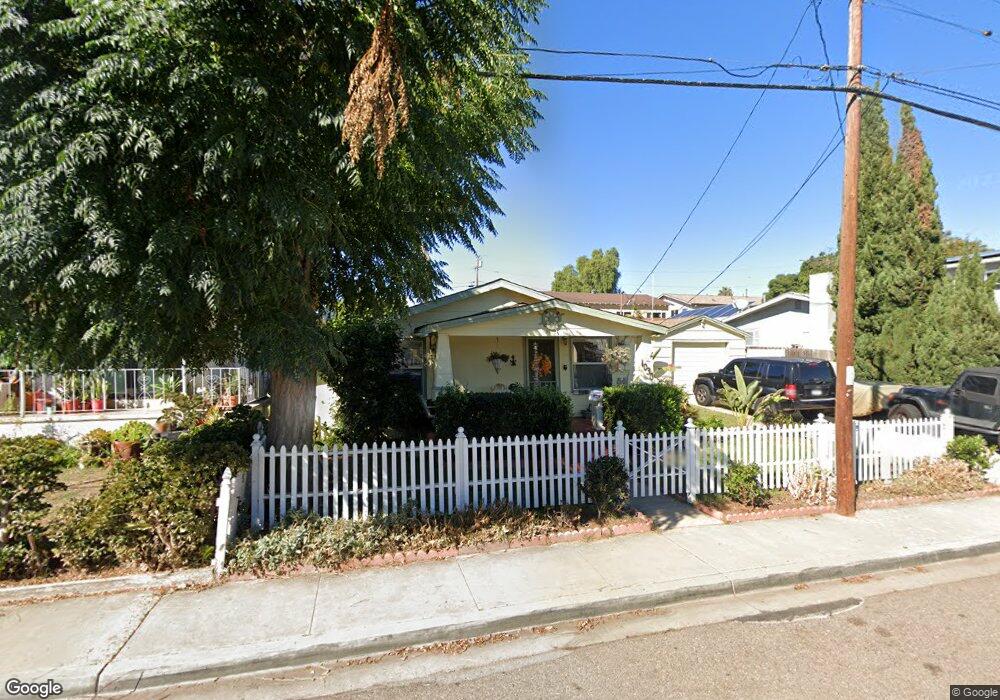
1030 8th St Imperial Beach, CA 91932
Estimated Value: $612,000 - $685,000
2
Beds
1
Bath
768
Sq Ft
$857/Sq Ft
Est. Value
About This Home
This home is located at 1030 8th St, Imperial Beach, CA 91932 and is currently estimated at $658,330, approximately $857 per square foot. 1030 8th St is a home located in San Diego County with nearby schools including Mar Vista Academy, Mar Vista Senior High School, and Imperial Beach Charter School.
Ownership History
Date
Name
Owned For
Owner Type
Purchase Details
Closed on
May 13, 2025
Sold by
Kanter Joan and Buck George Kenneth
Bought by
Kanter-Buck Family Trust and Kanter
Current Estimated Value
Purchase Details
Closed on
Feb 14, 2000
Sold by
Balzer Richard W and Huftill Angela L
Bought by
Mcgriff James and Mcgriff Rosalea
Home Financials for this Owner
Home Financials are based on the most recent Mortgage that was taken out on this home.
Original Mortgage
$133,896
Interest Rate
8.55%
Mortgage Type
FHA
Purchase Details
Closed on
Jun 10, 1983
Create a Home Valuation Report for This Property
The Home Valuation Report is an in-depth analysis detailing your home's value as well as a comparison with similar homes in the area
Home Values in the Area
Average Home Value in this Area
Purchase History
| Date | Buyer | Sale Price | Title Company |
|---|---|---|---|
| Kanter-Buck Family Trust | -- | None Listed On Document | |
| Mcgriff James | $135,000 | First American Title Ins Co | |
| -- | $42,000 | -- |
Source: Public Records
Mortgage History
| Date | Status | Borrower | Loan Amount |
|---|---|---|---|
| Previous Owner | Mcgriff James | $133,896 |
Source: Public Records
Tax History
| Year | Tax Paid | Tax Assessment Tax Assessment Total Assessment is a certain percentage of the fair market value that is determined by local assessors to be the total taxable value of land and additions on the property. | Land | Improvement |
|---|---|---|---|---|
| 2025 | $2,802 | $203,396 | $154,989 | $48,407 |
| 2024 | $2,802 | $199,408 | $151,950 | $47,458 |
| 2023 | $2,756 | $195,499 | $148,971 | $46,528 |
| 2022 | $3,187 | $191,666 | $146,050 | $45,616 |
| 2021 | $3,166 | $187,909 | $143,187 | $44,722 |
| 2020 | $2,857 | $185,983 | $141,719 | $44,264 |
| 2019 | $2,776 | $182,338 | $138,941 | $43,397 |
| 2018 | $2,667 | $178,764 | $136,217 | $42,547 |
| 2017 | $140 | $175,260 | $133,547 | $41,713 |
| 2016 | $2,508 | $171,825 | $130,929 | $40,896 |
| 2015 | $2,458 | $169,245 | $128,963 | $40,282 |
| 2014 | $2,628 | $165,930 | $126,437 | $39,493 |
Source: Public Records
Map
Nearby Homes
Your Personal Tour Guide
Ask me questions while you tour the home.