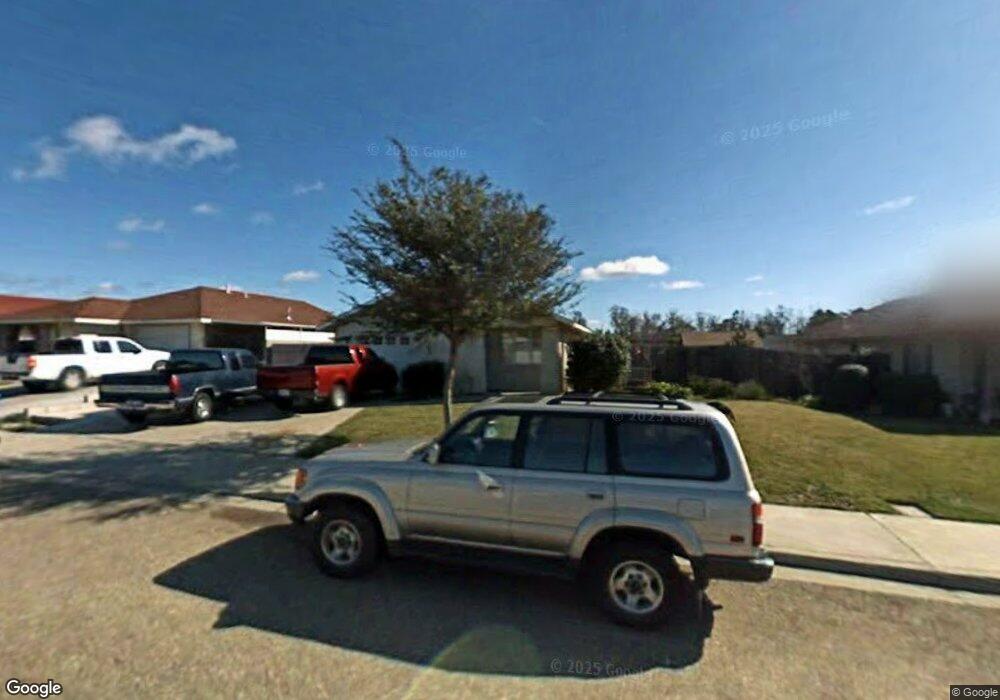
1030 Jeanette Ln Nipomo, CA 93444
Estimated Value: $596,241 - $630,000
3
Beds
2
Baths
1,106
Sq Ft
$559/Sq Ft
Est. Value
About This Home
This home is located at 1030 Jeanette Ln, Nipomo, CA 93444 and is currently estimated at $617,810, approximately $558 per square foot. 1030 Jeanette Ln is a home located in San Luis Obispo County with nearby schools including Dorothea Lange Elementary School, Mesa Middle School, and Nipomo High School.
Ownership History
Date
Name
Owned For
Owner Type
Purchase Details
Closed on
Nov 9, 2012
Sold by
Cuevas Maria
Bought by
Cuevas Manuel
Current Estimated Value
Home Financials for this Owner
Home Financials are based on the most recent Mortgage that was taken out on this home.
Original Mortgage
$214,051
Outstanding Balance
$146,929
Interest Rate
3.25%
Mortgage Type
FHA
Estimated Equity
$470,881
Purchase Details
Closed on
Oct 29, 2012
Sold by
Tapia Jose Luis and Tapia Rosa S
Bought by
Cuevas Manuel
Home Financials for this Owner
Home Financials are based on the most recent Mortgage that was taken out on this home.
Original Mortgage
$214,051
Outstanding Balance
$146,929
Interest Rate
3.25%
Mortgage Type
FHA
Estimated Equity
$470,881
Purchase Details
Closed on
May 27, 1994
Sold by
Peoples Self Help Housing Corp
Bought by
Tapia Jose Luis and Tapia Rosa S
Home Financials for this Owner
Home Financials are based on the most recent Mortgage that was taken out on this home.
Original Mortgage
$85,000
Interest Rate
8.53%
Create a Home Valuation Report for This Property
The Home Valuation Report is an in-depth analysis detailing your home's value as well as a comparison with similar homes in the area
Home Values in the Area
Average Home Value in this Area
Purchase History
| Date | Buyer | Sale Price | Title Company |
|---|---|---|---|
| Cuevas Manuel | -- | First American Title Company | |
| Cuevas Manuel | $218,000 | First American Title Company | |
| Tapia Jose Luis | $50,000 | Cuesta Title Guaranty Compan |
Source: Public Records
Mortgage History
| Date | Status | Borrower | Loan Amount |
|---|---|---|---|
| Open | Cuevas Manuel | $214,051 | |
| Previous Owner | Tapia Jose Luis | $85,000 | |
| Closed | Tapia Jose Luis | $16,430 |
Source: Public Records
Tax History
| Year | Tax Paid | Tax Assessment Tax Assessment Total Assessment is a certain percentage of the fair market value that is determined by local assessors to be the total taxable value of land and additions on the property. | Land | Improvement |
|---|---|---|---|---|
| 2025 | $3,709 | $268,436 | $135,449 | $132,987 |
| 2024 | $3,648 | $263,174 | $132,794 | $130,380 |
| 2023 | $3,648 | $258,015 | $130,191 | $127,824 |
| 2022 | $3,481 | $252,957 | $127,639 | $125,318 |
| 2021 | $3,476 | $247,998 | $125,137 | $122,861 |
| 2020 | $3,445 | $245,456 | $123,854 | $121,602 |
| 2019 | $3,417 | $240,644 | $121,426 | $119,218 |
| 2018 | $3,365 | $235,927 | $119,046 | $116,881 |
| 2017 | $3,296 | $231,302 | $116,712 | $114,590 |
| 2016 | $3,131 | $226,768 | $114,424 | $112,344 |
| 2015 | $3,064 | $223,363 | $112,706 | $110,657 |
| 2014 | $2,976 | $218,989 | $110,499 | $108,490 |
Source: Public Records
Map
Nearby Homes
- 461 Saturn Ct
- 429 Saturn Ct
- 468 Neptune Dr
- 353 Uranus Ct
- 379 Mars Ct
- 522 Higos Way
- 245 Hazel Ln
- 366 Venus Ct
- 270 S Tejas Place
- 375 Kestrel Way
- 1263 La Loma Dr
- 640 Honey Grove Ln
- 959 Vista Verde Ln
- 689 Phoebe St
- 761 Riverside Rd
- 378 Avenida de Amigos
- 680 Hill St
- 250 Via Promesa
- 719 W Tefft St
- 525 Grande Ave Unit D
- 1044 Jeanette Ln
- 1020 Jeanette Ln
- 525 Angelina Ct
- 529 Angelina Ct
- 1046 Jeanette Ln
- 990 Jeanette Ln
- 519 Angelina Ct
- 1025 Jeanette Ln
- 513 Angelina Ct
- 1015 Jeanette Ln
- 533 Angelina Ct
- 1045 Jeanette Ln
- 970 Jeanette Ln
- 1060 Jeanette Ln
- 985 Jeanette Ln
- 505 Angelina Ct
- 1065 Jeanette Ln
- 535 Angelina Ct
- 965 Jeanette Ln
- 950 Jeanette Ln
Your Personal Tour Guide
Ask me questions while you tour the home.