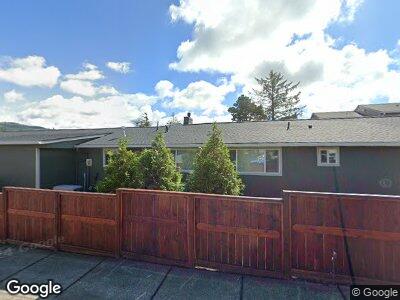
1030 N Roosevelt Dr Seaside, OR 97138
Estimated Value: $523,000 - $662,434
3
Beds
2
Baths
2,246
Sq Ft
$269/Sq Ft
Est. Value
About This Home
This home is located at 1030 N Roosevelt Dr, Seaside, OR 97138 and is currently estimated at $603,859, approximately $268 per square foot. 1030 N Roosevelt Dr is a home located in Clatsop County with nearby schools including Seaside High School.
Ownership History
Date
Name
Owned For
Owner Type
Purchase Details
Closed on
Sep 25, 2023
Sold by
Beach Development Llc
Bought by
Lowenberg Terry
Current Estimated Value
Purchase Details
Closed on
Nov 15, 2021
Sold by
Lowenberg Terry
Bought by
Beach Development Llc
Purchase Details
Closed on
Sep 16, 2021
Sold by
Beach Development Llc
Bought by
Lowenberg Terry
Purchase Details
Closed on
Jul 1, 2011
Sold by
Beach Development Llc
Bought by
Clatsop Community Bank
Purchase Details
Closed on
Nov 26, 2007
Sold by
Griffith Leah Marie and Taylor Teresa Ann
Bought by
Beach Development Llc
Home Financials for this Owner
Home Financials are based on the most recent Mortgage that was taken out on this home.
Original Mortgage
$375,000
Interest Rate
6.15%
Mortgage Type
Commercial
Create a Home Valuation Report for This Property
The Home Valuation Report is an in-depth analysis detailing your home's value as well as a comparison with similar homes in the area
Home Values in the Area
Average Home Value in this Area
Purchase History
| Date | Buyer | Sale Price | Title Company |
|---|---|---|---|
| Lowenberg Terry | $310,000 | None Listed On Document | |
| Beach Development Llc | $310,000 | None Available | |
| Lowenberg Terry | $310,000 | None Available | |
| Clatsop Community Bank | $2,405,000 | Ticor Title Ins Co | |
| Beach Development Llc | $465,000 | Ticor Title Insurance Co |
Source: Public Records
Mortgage History
| Date | Status | Borrower | Loan Amount |
|---|---|---|---|
| Previous Owner | Beach Development Llc | $375,000 |
Source: Public Records
Tax History Compared to Growth
Tax History
| Year | Tax Paid | Tax Assessment Tax Assessment Total Assessment is a certain percentage of the fair market value that is determined by local assessors to be the total taxable value of land and additions on the property. | Land | Improvement |
|---|---|---|---|---|
| 2024 | $5,588 | $389,008 | -- | -- |
| 2023 | $5,295 | $368,735 | $0 | $0 |
| 2022 | $5,150 | $357,996 | $0 | $0 |
| 2021 | $3,616 | $249,295 | $0 | $0 |
| 2020 | $3,676 | $251,945 | $0 | $0 |
| 2019 | $3,576 | $244,608 | $0 | $0 |
| 2018 | $3,434 | $237,484 | $0 | $0 |
| 2017 | $3,193 | $230,568 | $0 | $0 |
| 2016 | $2,689 | $223,854 | $64,958 | $158,896 |
| 2015 | $2,521 | $209,182 | $72,174 | $137,008 |
| 2014 | $2,485 | $194,587 | $0 | $0 |
| 2013 | -- | $199,974 | $0 | $0 |
Source: Public Records
Map
Nearby Homes