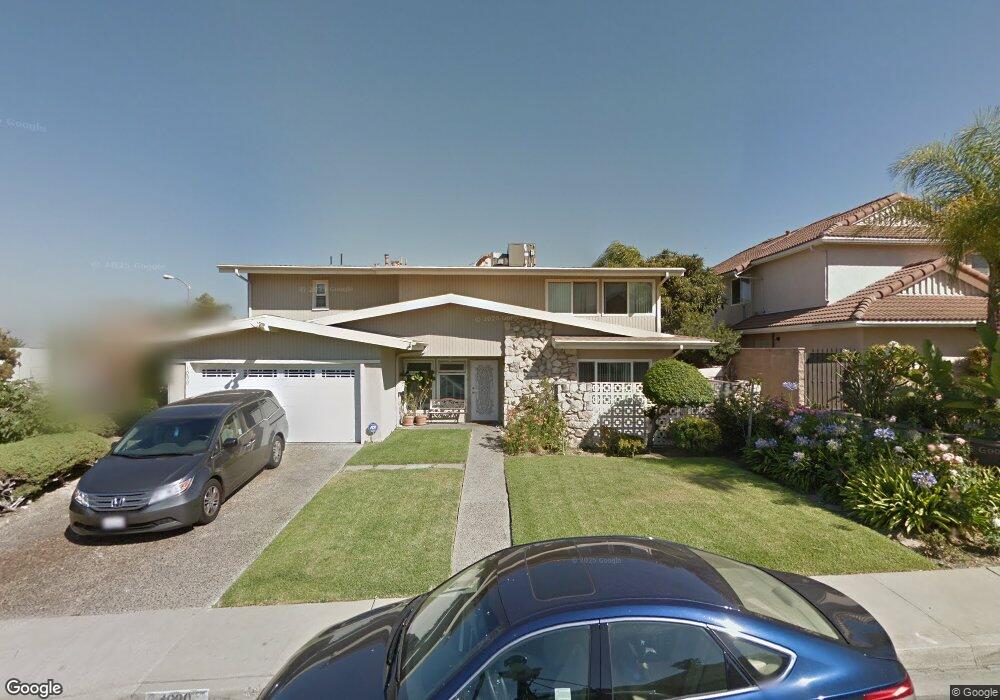
1030 Ridgeside Dr Monterey Park, CA 91754
Estimated Value: $1,357,448 - $1,671,000
4
Beds
3
Baths
2,820
Sq Ft
$523/Sq Ft
Est. Value
About This Home
This home is located at 1030 Ridgeside Dr, Monterey Park, CA 91754 and is currently estimated at $1,475,362, approximately $523 per square foot. 1030 Ridgeside Dr is a home located in Los Angeles County with nearby schools including Brightwood Elementary School, Mark Keppel High School, and KIPP Iluminar Academy.
Ownership History
Date
Name
Owned For
Owner Type
Purchase Details
Closed on
Oct 28, 2023
Sold by
Ng David Yui Ming and Ng Brenda Suk
Bought by
Ng David Yui Ming
Current Estimated Value
Home Financials for this Owner
Home Financials are based on the most recent Mortgage that was taken out on this home.
Original Mortgage
$350,000
Outstanding Balance
$343,523
Interest Rate
7.19%
Mortgage Type
New Conventional
Estimated Equity
$1,131,839
Purchase Details
Closed on
Apr 3, 2006
Sold by
Sham Thomas Wan
Bought by
Ng David Yui Ming and Lee Brenda Suk Bing
Purchase Details
Closed on
Jan 29, 1997
Sold by
Home Svgs Of America Fsb
Bought by
Sham Thomas Wan and Lam Belisa L
Home Financials for this Owner
Home Financials are based on the most recent Mortgage that was taken out on this home.
Original Mortgage
$225,000
Interest Rate
7.9%
Mortgage Type
Seller Take Back
Purchase Details
Closed on
Oct 4, 1996
Sold by
Tan Stephen K
Bought by
Home Svgs Of America Fsb
Create a Home Valuation Report for This Property
The Home Valuation Report is an in-depth analysis detailing your home's value as well as a comparison with similar homes in the area
Home Values in the Area
Average Home Value in this Area
Purchase History
| Date | Buyer | Sale Price | Title Company |
|---|---|---|---|
| Ng David Yui Ming | -- | First Integrity Title Company | |
| Ng David Yui Ming | $780,000 | Lawyers Title | |
| Sham Thomas Wan | $300,000 | Investors Title Company | |
| Home Svgs Of America Fsb | $276,250 | Fidelity National Title Ins |
Source: Public Records
Mortgage History
| Date | Status | Borrower | Loan Amount |
|---|---|---|---|
| Open | Ng David Yui Ming | $350,000 | |
| Previous Owner | Sham Thomas Wan | $225,000 |
Source: Public Records
Tax History
| Year | Tax Paid | Tax Assessment Tax Assessment Total Assessment is a certain percentage of the fair market value that is determined by local assessors to be the total taxable value of land and additions on the property. | Land | Improvement |
|---|---|---|---|---|
| 2025 | $13,787 | $1,065,919 | $712,939 | $352,980 |
| 2024 | $13,787 | $1,045,019 | $698,960 | $346,059 |
| 2023 | $13,510 | $1,024,529 | $685,255 | $339,274 |
| 2022 | $12,866 | $1,004,441 | $671,819 | $332,622 |
| 2021 | $12,712 | $984,747 | $658,647 | $326,100 |
| 2019 | $12,257 | $955,541 | $639,112 | $316,429 |
| 2018 | $12,268 | $936,806 | $626,581 | $310,225 |
| 2016 | $11,307 | $900,431 | $602,251 | $298,180 |
| 2015 | $10,733 | $854,000 | $571,000 | $283,000 |
| 2014 | $9,795 | $772,800 | $516,900 | $255,900 |
Source: Public Records
Map
Nearby Homes
- 1301 S Atlantic Blvd Unit 337
- 1301 S Atlantic Blvd Unit 425
- 1301 S Atlantic Blvd Unit 101
- 1301 S Atlantic Blvd Unit 231
- 1301 S Atlantic Blvd Unit 414
- 1034 Loma Verde St
- 0 S Prospect Dr Unit CV23115343
- 1400 Loma Verde St
- 710 Kingsford St
- 1300 Mira Valle St
- 1515 Lunar Dr
- 510 Hermosa Vista St
- 1121 Williams St
- 1176 W Mabel Ave
- 715 W Graves Ave
- 1389 Hillside St
- 1718 S Mcpherrin Ave
- 501 Almora St
- 1001 Abajo Dr
- 1641 Copa Way
- 1050 Ridgeside Dr
- 1022 Ridgeside Dr
- 1066 Ridgeside Dr
- 1000 Ridgeside Dr
- 1014 Ridgeside Dr
- 1025 Ridgeside Dr
- 1041 Ridgeside Dr
- 1086 Ridgeside Dr
- 1057 Ridgeside Dr
- 1009 Ridgeside Dr
- 1006 Ridgeside Dr
- 1075 Ridgeside Dr
- 978 Ridgeside Dr
- 991 Ridgeside Dr
- 883 Scudder Way
- 1100 Ridgeside Dr
- 887 Scudder Way
- 1095 Ridgeside Dr
- 881 Scudder Way
- 1039 Snyder Ln
Your Personal Tour Guide
Ask me questions while you tour the home.