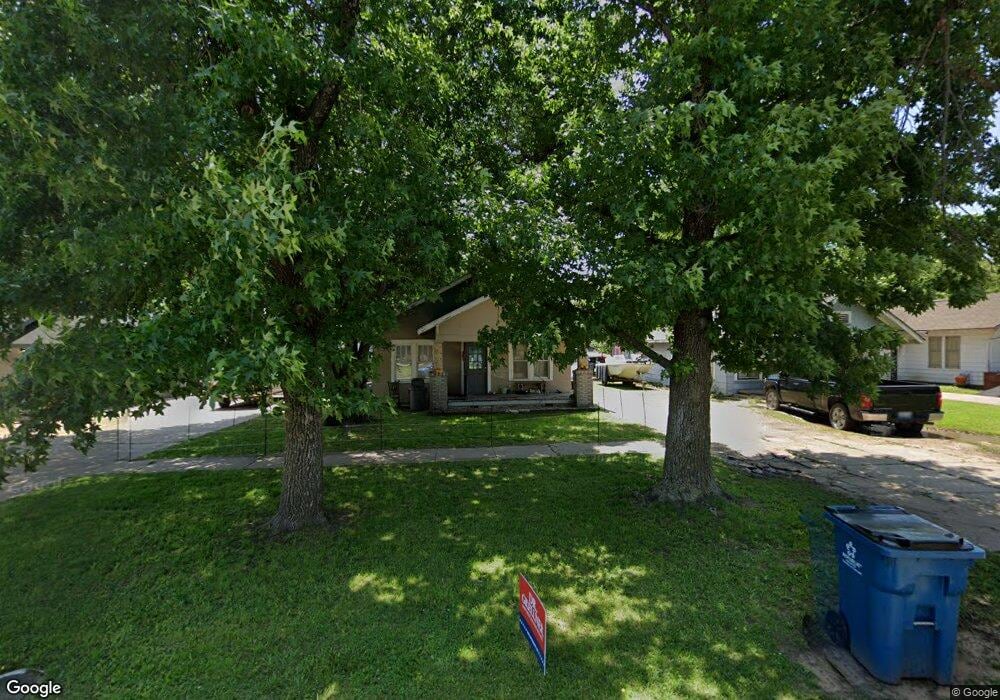
1031 E Moses St Cushing, OK 74023
Estimated Value: $70,406 - $118,000
3
Beds
1
Bath
1,128
Sq Ft
$81/Sq Ft
Est. Value
About This Home
This home is located at 1031 E Moses St, Cushing, OK 74023 and is currently estimated at $91,352, approximately $80 per square foot. 1031 E Moses St is a home located in Payne County with nearby schools including Cushing Upper Elementary School, Cushing Lower Elementary School, and Cushing High School.
Ownership History
Date
Name
Owned For
Owner Type
Purchase Details
Closed on
Nov 10, 2017
Sold by
Sg Capital Partners Llc
Bought by
Herrmann Kevin Ray
Current Estimated Value
Purchase Details
Closed on
Feb 21, 2012
Sold by
Fannie Mae
Bought by
Harbour Porfolio Vii Lp
Purchase Details
Closed on
Jun 9, 2009
Sold by
Denoya Melissa Ray
Bought by
Brace Marvin Ray
Purchase Details
Closed on
Mar 8, 2007
Sold by
Sewell Ryan
Bought by
Brace Marvin R and Brace Melissa
Home Financials for this Owner
Home Financials are based on the most recent Mortgage that was taken out on this home.
Original Mortgage
$56,000
Interest Rate
6.25%
Mortgage Type
New Conventional
Purchase Details
Closed on
Aug 3, 2006
Sold by
Church Donnie
Bought by
Sewell Ryan
Create a Home Valuation Report for This Property
The Home Valuation Report is an in-depth analysis detailing your home's value as well as a comparison with similar homes in the area
Purchase History
| Date | Buyer | Sale Price | Title Company |
|---|---|---|---|
| Herrmann Kevin Ray | $15,000 | None Available | |
| Harbour Porfolio Vii Lp | -- | None Available | |
| Brace Marvin Ray | -- | -- | |
| Brace Marvin R | $56,000 | None Available | |
| Sewell Ryan | $19,000 | None Available |
Source: Public Records
Mortgage History
| Date | Status | Borrower | Loan Amount |
|---|---|---|---|
| Previous Owner | Brace Marvin R | $56,000 |
Source: Public Records
Tax History
| Year | Tax Paid | Tax Assessment Tax Assessment Total Assessment is a certain percentage of the fair market value that is determined by local assessors to be the total taxable value of land and additions on the property. | Land | Improvement |
|---|---|---|---|---|
| 2025 | $374 | $4,013 | $291 | $3,722 |
| 2024 | $340 | $4,013 | $291 | $3,722 |
| 2023 | $340 | $3,822 | $352 | $3,470 |
| 2022 | $310 | $3,640 | $405 | $3,235 |
| 2021 | $288 | $3,467 | $414 | $3,053 |
| 2020 | $270 | $3,302 | $301 | $3,001 |
| 2019 | $270 | $3,145 | $570 | $2,575 |
| 2018 | $261 | $3,145 | $570 | $2,575 |
| 2017 | $260 | $3,145 | $570 | $2,575 |
| 2016 | $266 | $3,145 | $570 | $2,575 |
| 2015 | $311 | $3,596 | $415 | $3,181 |
| 2014 | $310 | $3,596 | $415 | $3,181 |
Source: Public Records
Map
Nearby Homes
- 112 S Highland Ave
- 1002 E Cherry St
- 915 E Oak St
- 933 E Maple St
- 1224 E Cherry St
- 1217 E Cherry St
- 1301 E Ash St
- 919 E 2nd St
- 1318 E Oak St
- 1003 E 4th St
- 732 E Broadway St
- 1236 E Main St
- 724 E Moses St
- 843 E 4th St
- 708 E Broadway St
- 1417 E Oak St
- 508 S Michigan Ave
- 1436 E Moses St
- 1001 E Pecan St
- 1133 E Pecan St
- 1027 E Moses St
- 1035 E Moses St
- 1025 E Moses St
- 1023 E Moses St
- 1045 E Moses St
- 1024 E Broadway St
- 1032 E Broadway St
- 1019 E Moses St
- 1020 E Broadway St
- 1013 E Moses St
- 1036 E Broadway St
- 1032 E Moses St
- 1030 E Moses St
- 1034 E Broadway St
- 1026 E Moses St
- 1038 E Moses St
- 1046 E Moses St
- 1016 E Broadway St
- 1020 E Moses St
- 1101 E Moses St
Your Personal Tour Guide
Ask me questions while you tour the home.