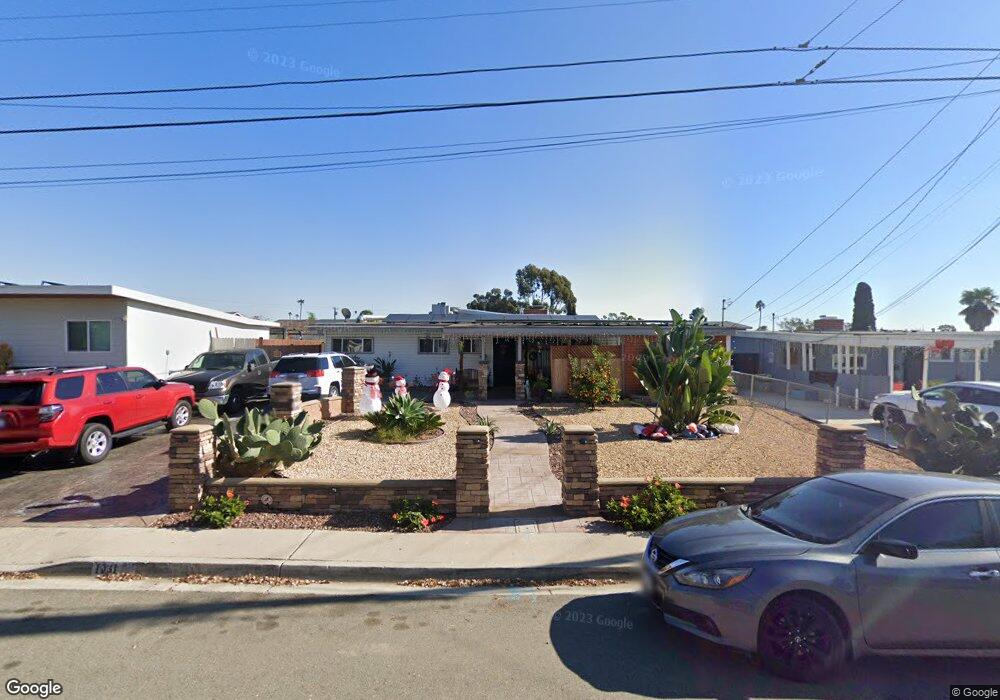
1031 Helix Ave Chula Vista, CA 91911
Castle Park NeighborhoodEstimated Value: $742,950 - $911,000
3
Beds
2
Baths
1,164
Sq Ft
$675/Sq Ft
Est. Value
About This Home
This home is located at 1031 Helix Ave, Chula Vista, CA 91911 and is currently estimated at $785,238, approximately $674 per square foot. 1031 Helix Ave is a home located in San Diego County with nearby schools including Cook Elementary School, Hilltop Middle School, and Hilltop Senior High School.
Ownership History
Date
Name
Owned For
Owner Type
Purchase Details
Closed on
Jun 25, 2016
Sold by
Vonvonstuck Linda Von and Morgan Cathy
Bought by
Estrada Rudy B and Blancarte Priscela
Current Estimated Value
Home Financials for this Owner
Home Financials are based on the most recent Mortgage that was taken out on this home.
Original Mortgage
$391,773
Outstanding Balance
$320,751
Interest Rate
4.4%
Mortgage Type
FHA
Estimated Equity
$464,487
Purchase Details
Closed on
Sep 18, 2009
Sold by
Kent Verla M
Bought by
Kent Verla M
Home Financials for this Owner
Home Financials are based on the most recent Mortgage that was taken out on this home.
Original Mortgage
$160,000
Interest Rate
5.25%
Mortgage Type
New Conventional
Purchase Details
Closed on
Nov 9, 1994
Sold by
Kent Verla M
Bought by
Kent Jerry G and Kent Verla M
Create a Home Valuation Report for This Property
The Home Valuation Report is an in-depth analysis detailing your home's value as well as a comparison with similar homes in the area
Home Values in the Area
Average Home Value in this Area
Purchase History
| Date | Buyer | Sale Price | Title Company |
|---|---|---|---|
| Estrada Rudy B | $399,000 | Fidelity Title | |
| Kent Verla M | -- | Pacific Coast Title | |
| Kent Verla M | -- | Pct | |
| Kent Jerry G | -- | -- |
Source: Public Records
Mortgage History
| Date | Status | Borrower | Loan Amount |
|---|---|---|---|
| Open | Estrada Rudy B | $391,773 | |
| Previous Owner | Kent Verla M | $160,000 |
Source: Public Records
Tax History Compared to Growth
Tax History
| Year | Tax Paid | Tax Assessment Tax Assessment Total Assessment is a certain percentage of the fair market value that is determined by local assessors to be the total taxable value of land and additions on the property. | Land | Improvement |
|---|---|---|---|---|
| 2025 | $5,259 | $463,067 | $376,026 | $87,041 |
| 2024 | $5,259 | $453,988 | $368,653 | $85,335 |
| 2023 | $5,186 | $445,087 | $361,425 | $83,662 |
| 2022 | $5,035 | $436,361 | $354,339 | $82,022 |
| 2021 | $4,917 | $427,806 | $347,392 | $80,414 |
| 2020 | $4,799 | $423,420 | $343,830 | $79,590 |
| 2019 | $4,674 | $415,119 | $337,089 | $78,030 |
| 2018 | $4,600 | $406,980 | $330,480 | $76,500 |
| 2017 | $4,503 | $399,000 | $137,309 | $261,691 |
| 2016 | $622 | $52,189 | $17,960 | $34,229 |
| 2015 | $534 | $51,406 | $17,691 | $33,715 |
| 2014 | $525 | $50,400 | $17,345 | $33,055 |
Source: Public Records
Map
Nearby Homes
- 172 Inkopah St
- 974 Helix Ave
- 158 E L St
- 62 Country Club Cir
- 93 E Oxford St
- 206 E Emerson St
- 883 Monserate Ave
- 177 El Capitan Dr
- 205 Camlau Dr Unit C
- 166 Camino Vista Real
- 151 Camino Vista Real
- 1242 Josselyn Ave
- 0 Telegraph Canyon Rd Unit PTP2500640
- 1236 Tobias Dr
- 945 Nacion Ave
- 859 Tamayo Dr Unit 1
- 859 Tamayo Dr Unit 2
- 820 Tamayo Dr Unit 2
- 1293 Nolan Ave
- 202 E J St
- 1033 Helix Ave
- 1027 Helix Ave
- 1035 Helix Ave
- 1023 Helix Ave
- 1028 Guatay Ave
- 1026 Guatay Ave
- 1030 Guatay Ave
- 1024 Guatay Ave
- 1030 Helix Ave
- 1021 Helix Ave
- 1032 Helix Ave
- 1037 Helix Ave
- 1034 Guatay Ave
- 1026 Helix Ave
- 1034 Helix Ave
- 1022 Guatay Ave
- 1022 Helix Ave
- 1036 Helix Ave
- 1038 Guatay Ave
- 1017 Helix Ave