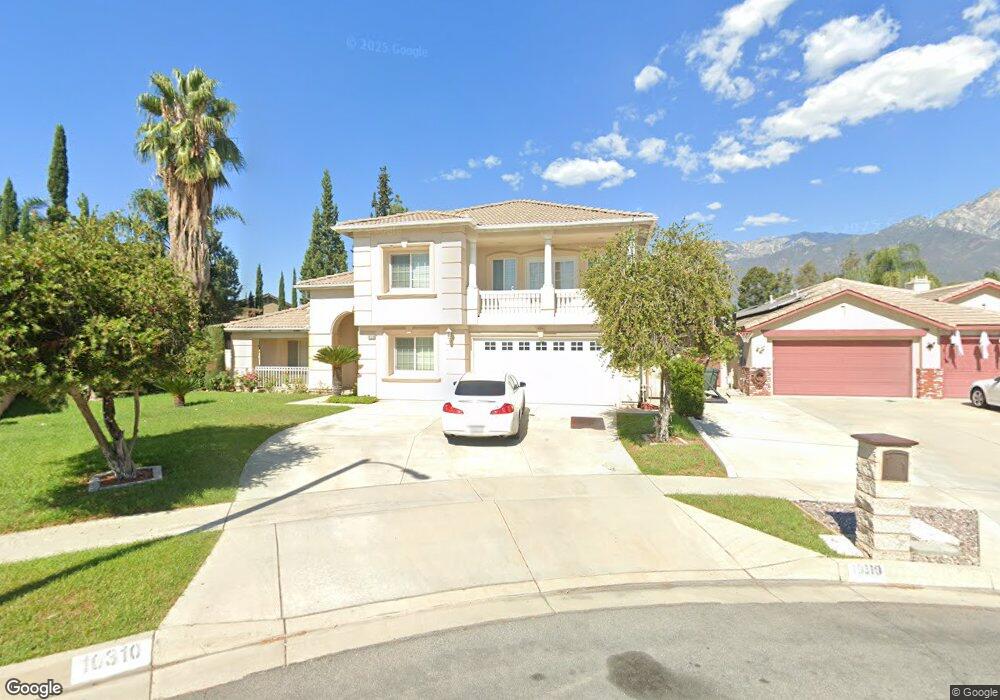
10310 Finch Ave Rancho Cucamonga, CA 91737
Estimated Value: $948,000 - $1,141,000
7
Beds
4
Baths
3,190
Sq Ft
$332/Sq Ft
Est. Value
About This Home
This home is located at 10310 Finch Ave, Rancho Cucamonga, CA 91737 and is currently estimated at $1,057,929, approximately $331 per square foot. 10310 Finch Ave is a home located in San Bernardino County with nearby schools including Deer Canyon Elementary, Vineyard Junior High, and Los Osos High.
Ownership History
Date
Name
Owned For
Owner Type
Purchase Details
Closed on
Jan 21, 2000
Sold by
Overland R C 29 Llc
Bought by
Mwiti Peter and Mwiti Esther
Current Estimated Value
Home Financials for this Owner
Home Financials are based on the most recent Mortgage that was taken out on this home.
Original Mortgage
$228,424
Interest Rate
8.24%
Purchase Details
Closed on
Dec 12, 1997
Sold by
Herr Millard and Herr Rhoda
Bought by
Overland R C 29 Llc
Home Financials for this Owner
Home Financials are based on the most recent Mortgage that was taken out on this home.
Original Mortgage
$2,601,500
Interest Rate
7.16%
Mortgage Type
Construction
Create a Home Valuation Report for This Property
The Home Valuation Report is an in-depth analysis detailing your home's value as well as a comparison with similar homes in the area
Home Values in the Area
Average Home Value in this Area
Purchase History
| Date | Buyer | Sale Price | Title Company |
|---|---|---|---|
| Mwiti Peter | $238,000 | Chicago Title | |
| Overland R C 29 Llc | $797,500 | Chicago Title |
Source: Public Records
Mortgage History
| Date | Status | Borrower | Loan Amount |
|---|---|---|---|
| Previous Owner | Mwiti Peter | $228,424 | |
| Previous Owner | Overland R C 29 Llc | $2,601,500 | |
| Closed | Overland R C 29 Llc | $290,000 |
Source: Public Records
Tax History Compared to Growth
Tax History
| Year | Tax Paid | Tax Assessment Tax Assessment Total Assessment is a certain percentage of the fair market value that is determined by local assessors to be the total taxable value of land and additions on the property. | Land | Improvement |
|---|---|---|---|---|
| 2025 | $6,229 | $568,896 | $91,446 | $477,450 |
| 2024 | $6,229 | $557,741 | $89,653 | $468,088 |
| 2023 | $6,090 | $546,805 | $87,895 | $458,910 |
| 2022 | $6,074 | $536,084 | $86,172 | $449,912 |
| 2021 | $6,071 | $525,572 | $84,482 | $441,090 |
| 2020 | $5,826 | $520,183 | $83,616 | $436,567 |
| 2019 | $5,890 | $509,983 | $81,976 | $428,007 |
| 2018 | $5,759 | $499,984 | $80,369 | $419,615 |
| 2017 | $5,502 | $490,180 | $78,793 | $411,387 |
| 2016 | $5,355 | $480,569 | $77,248 | $403,321 |
| 2015 | $5,321 | $473,351 | $76,088 | $397,263 |
| 2014 | $5,173 | $464,079 | $74,598 | $389,481 |
Source: Public Records
Map
Nearby Homes
- 6644 Brissac Place
- 10123 Finch Ave
- 6600 Montresor Place
- 10414 Hamilton St
- 10456 Hamilton St
- 10141 Orange St
- 6281 Kinlock Ave
- 6210 Halstead Ave
- 10393 Cartilla Ct
- 10088 Goldenrod Ct
- 10655 Lemon Ave Unit 2703
- 10655 Lemon Ave Unit 2605
- 10655 Lemon Ave Unit 1710
- 10655 Lemon Ave Unit 4004
- 10655 Lemon Ave Unit 1508
- 10655 Lemon Ave Unit 3004
- 10655 Lemon Ave Unit 4009
- 10655 Lemon Ave Unit 3613
- 10655 Lemon Ave Unit 3912
- 6162 Mayberry Ave
- 10320 Finch Ave
- 6559 Halstead Ave
- 6551 Halstead Ave
- 6569 Halstead Ave
- 10330 Finch Ave
- 6549 Halstead Ave
- 6579 Halstead Ave
- 10321 Finch Ave
- 10340 Finch Ave
- 6589 Halstead Ave
- 10331 Finch Ave
- 10341 Finch Ave
- 6599 Halstead Ave
- 10350 Finch Ave
- 6558 Halstead Ave
- 6568 Halstead Ave
- 6548 Halstead Ave
- 6578 Halstead Ave
- 10351 Finch Ave
- 6609 Halstead Ave