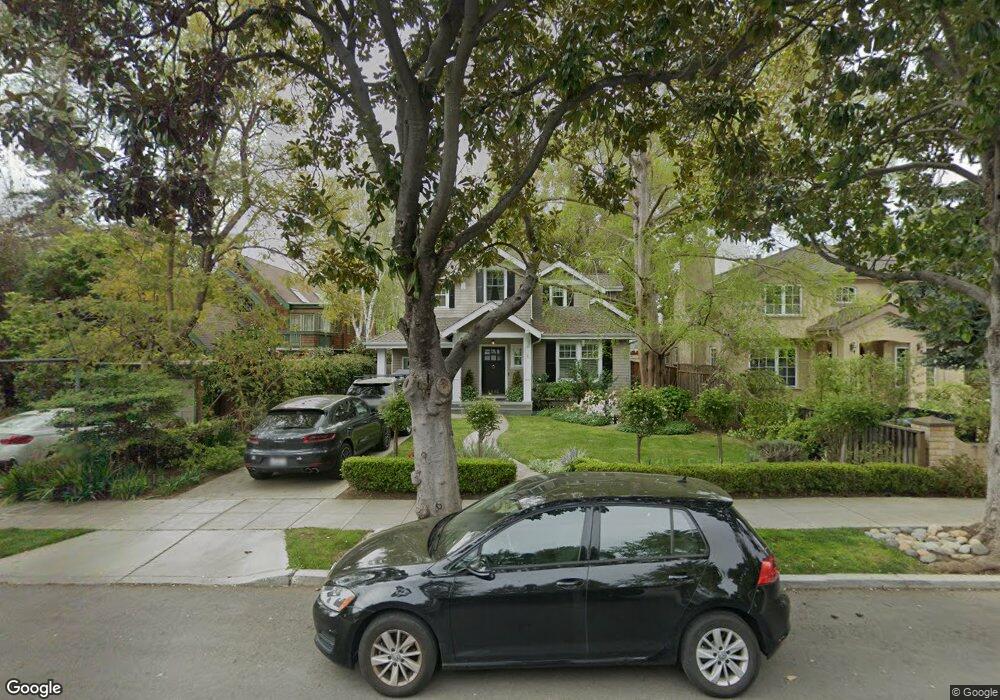
1032 Forest Ave Palo Alto, CA 94301
Crescent Park NeighborhoodEstimated Value: $5,780,000 - $6,568,000
4
Beds
4
Baths
3,272
Sq Ft
$1,871/Sq Ft
Est. Value
About This Home
This home is located at 1032 Forest Ave, Palo Alto, CA 94301 and is currently estimated at $6,121,219, approximately $1,870 per square foot. 1032 Forest Ave is a home located in Santa Clara County with nearby schools including Addison Elementary School, Frank S. Greene Jr. Middle, and Palo Alto High School.
Ownership History
Date
Name
Owned For
Owner Type
Purchase Details
Closed on
Dec 28, 2012
Sold by
Knoblock Bruce A and Knoblock Dara M
Bought by
Knoblock Bruce and Knoblock Dara
Current Estimated Value
Home Financials for this Owner
Home Financials are based on the most recent Mortgage that was taken out on this home.
Original Mortgage
$553,500
Outstanding Balance
$383,046
Interest Rate
3.27%
Mortgage Type
New Conventional
Estimated Equity
$5,738,173
Purchase Details
Closed on
May 8, 2012
Sold by
Knoblock Bruce and Knoblock Dara
Bought by
Knoblock Bruce and Knoblock Dara
Purchase Details
Closed on
Jun 13, 2003
Sold by
Kolling Karen
Bought by
Knoblock Bruce A and Knoblock Dara
Home Financials for this Owner
Home Financials are based on the most recent Mortgage that was taken out on this home.
Original Mortgage
$650,000
Interest Rate
5.53%
Mortgage Type
Purchase Money Mortgage
Create a Home Valuation Report for This Property
The Home Valuation Report is an in-depth analysis detailing your home's value as well as a comparison with similar homes in the area
Home Values in the Area
Average Home Value in this Area
Purchase History
| Date | Buyer | Sale Price | Title Company |
|---|---|---|---|
| Knoblock Bruce | -- | Old Republic Title Company | |
| Knoblock Bruce A | -- | Old Republic Title Company | |
| Knoblock Bruce | -- | None Available | |
| Knoblock Bruce | -- | None Available | |
| Knoblock Bruce A | $1,187,500 | First American Title Co |
Source: Public Records
Mortgage History
| Date | Status | Borrower | Loan Amount |
|---|---|---|---|
| Open | Knoblock Bruce A | $553,500 | |
| Closed | Knoblock Bruce A | $650,000 | |
| Closed | Knoblock Bruce A | $300,000 |
Source: Public Records
Tax History Compared to Growth
Tax History
| Year | Tax Paid | Tax Assessment Tax Assessment Total Assessment is a certain percentage of the fair market value that is determined by local assessors to be the total taxable value of land and additions on the property. | Land | Improvement |
|---|---|---|---|---|
| 2025 | $35,007 | $3,029,308 | $1,719,533 | $1,309,775 |
| 2024 | $35,007 | $2,969,911 | $1,685,817 | $1,284,094 |
| 2023 | $35,368 | $2,911,678 | $1,652,762 | $1,258,916 |
| 2022 | $34,961 | $2,854,587 | $1,620,355 | $1,234,232 |
| 2021 | $34,273 | $2,798,616 | $1,588,584 | $1,210,032 |
| 2020 | $33,562 | $2,769,921 | $1,572,296 | $1,197,625 |
| 2019 | $33,194 | $2,715,610 | $1,541,467 | $1,174,143 |
| 2018 | $32,279 | $2,662,364 | $1,511,243 | $1,151,121 |
| 2017 | $31,713 | $2,610,161 | $1,481,611 | $1,128,550 |
| 2016 | $30,790 | $2,550,982 | $1,452,560 | $1,098,422 |
| 2015 | $29,668 | $2,442,732 | $1,430,742 | $1,011,990 |
| 2014 | $29,085 | $2,394,883 | $1,402,716 | $992,167 |
Source: Public Records
Map
Nearby Homes
- 1101 Hamilton Ave
- 961 Channing Ave
- 755 Homer Ave
- 1033 Guinda St
- 1301 Forest Ave
- 637 Channing Ave
- 555 Byron St Unit 104
- 707 Webster St
- 20 Kent Place
- 1049 Woodland Ave
- 671 Kingsley Ave
- 560 Addison Ave
- 1908 Menalto Ave
- 759 Cowper St
- 536 Addison Ave
- 1218 Middlefield Rd
- 251 Middlefield Rd
- 90 Crescent Dr
- 447 Homer Ave
- 212 Gilbert Ave