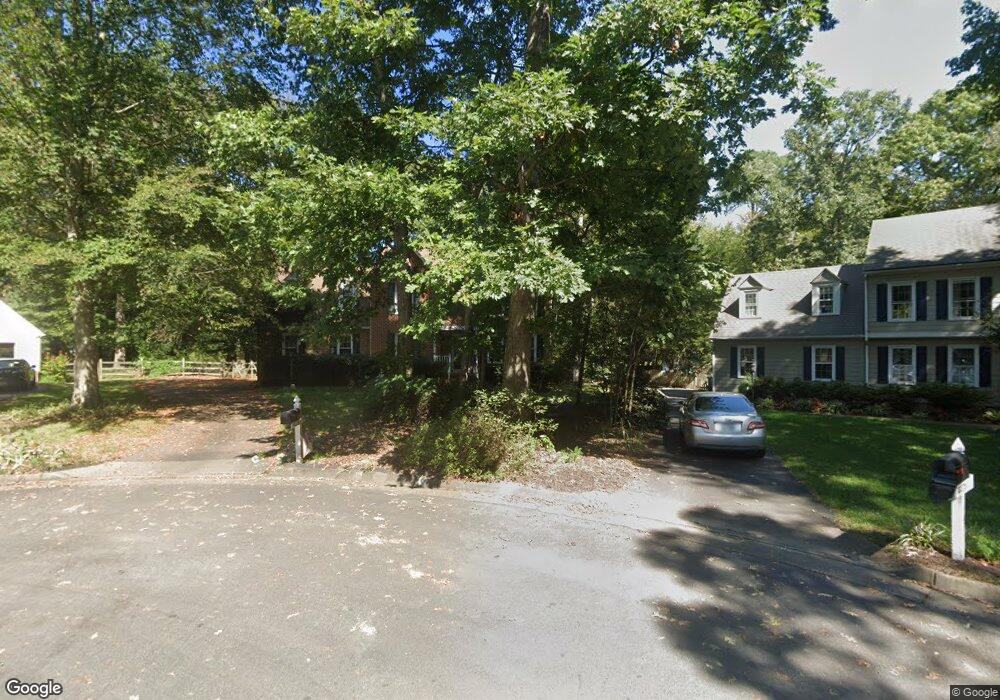
10328 Berkeley Manor Dr Mechanicsville, VA 23116
Atlee NeighborhoodEstimated Value: $453,000 - $487,000
4
Beds
3
Baths
1,924
Sq Ft
$246/Sq Ft
Est. Value
About This Home
This home is located at 10328 Berkeley Manor Dr, Mechanicsville, VA 23116 and is currently estimated at $472,463, approximately $245 per square foot. 10328 Berkeley Manor Dr is a home located in Hanover County with nearby schools including Cool Spring Elementary School, Chickahominy Middle School, and Atlee High School.
Ownership History
Date
Name
Owned For
Owner Type
Purchase Details
Closed on
Jun 6, 2018
Sold by
Hyde Brian L and Hyde Jennifer M
Bought by
Stallard Jon M and Stallard Tami B
Current Estimated Value
Home Financials for this Owner
Home Financials are based on the most recent Mortgage that was taken out on this home.
Original Mortgage
$276,300
Outstanding Balance
$238,953
Interest Rate
4.5%
Mortgage Type
FHA
Estimated Equity
$233,510
Purchase Details
Closed on
Jun 21, 2002
Sold by
Fogler Dennis
Bought by
Hyde Brian
Home Financials for this Owner
Home Financials are based on the most recent Mortgage that was taken out on this home.
Original Mortgage
$145,600
Interest Rate
6.92%
Mortgage Type
New Conventional
Purchase Details
Closed on
Jul 19, 2000
Sold by
Loughridge Jeff
Bought by
Fogler Dennis
Home Financials for this Owner
Home Financials are based on the most recent Mortgage that was taken out on this home.
Original Mortgage
$168,625
Interest Rate
8.18%
Create a Home Valuation Report for This Property
The Home Valuation Report is an in-depth analysis detailing your home's value as well as a comparison with similar homes in the area
Home Values in the Area
Average Home Value in this Area
Purchase History
| Date | Buyer | Sale Price | Title Company |
|---|---|---|---|
| Stallard Jon M | $307,000 | Attorney | |
| Hyde Brian | $182,000 | -- | |
| Fogler Dennis | $177,500 | -- |
Source: Public Records
Mortgage History
| Date | Status | Borrower | Loan Amount |
|---|---|---|---|
| Open | Stallard Jon M | $276,300 | |
| Previous Owner | Hyde Brian | $145,600 | |
| Previous Owner | Fogler Dennis | $168,625 |
Source: Public Records
Tax History Compared to Growth
Tax History
| Year | Tax Paid | Tax Assessment Tax Assessment Total Assessment is a certain percentage of the fair market value that is determined by local assessors to be the total taxable value of land and additions on the property. | Land | Improvement |
|---|---|---|---|---|
| 2025 | $3,323 | $404,600 | $105,000 | $299,600 |
| 2024 | $3,192 | $388,400 | $100,000 | $288,400 |
| 2023 | $2,806 | $358,500 | $90,000 | $268,500 |
| 2022 | $2,668 | $324,300 | $85,000 | $239,300 |
| 2021 | $2,459 | $299,100 | $80,000 | $219,100 |
| 2020 | $2,349 | $286,000 | $80,000 | $206,000 |
| 2019 | $2,125 | $286,000 | $80,000 | $206,000 |
| 2018 | $2,125 | $262,400 | $80,000 | $182,400 |
| 2017 | $2,125 | $262,400 | $80,000 | $182,400 |
| 2016 | $1,958 | $241,700 | $65,000 | $176,700 |
| 2015 | $1,958 | $241,700 | $65,000 | $176,700 |
| 2014 | $1,958 | $241,700 | $65,000 | $176,700 |
Source: Public Records
Map
Nearby Homes
- 9273 Susquehanna Trail
- 10292 Wanchese Way
- 9322 Ravensworth Ct
- 9523 Halifax Green Dr
- 10988 Milestone Dr
- 11012 Milestone Dr
- 9646 Sliding Hill Rd
- 9200 - Lot 1 Sliding Hill Rd
- 10112 Forrest Patch Dr
- 10108 Forrest Patch Dr
- 9428 Berry Patch Ln
- 10011 Berry Pond Ln
- 9509 Indianfield Dr
- 10434 Oak Cottage Dr
- 9426 Ashking Dr
- 9180 Breeders Cup Place
- 9128 Polo Pony Ct
- 9254 Giles Pond Dr
- 10032 Meadow Pond Dr
- 11033 Wychwood Dr
- 10326 Berkeley Manor Dr
- 10315 Nassawadox Way
- 10325 Berkeley Manor Dr
- 10324 Berkeley Manor Dr
- 10330 Rapidan Ct
- 10321 Nassawadox Way
- 10316 Nassawadox Way
- 10318 Berkeley Manor Dr
- 10321 Berkeley Manor Dr
- 10328 Rapidan Ct
- 10320 Nassawadox Way
- 10314 Nassawadox Way
- 10317 Berkeley Manor Dr
- 10304 Perrins Mill Ln
- 10327 Nassawadox Way
- 9326 Kings Charter Dr
- 10312 Berkeley Manor Dr
- 9322 Kings Charter Dr
- 9330 Kings Charter Dr
- 10302 Perrins Mill Ln