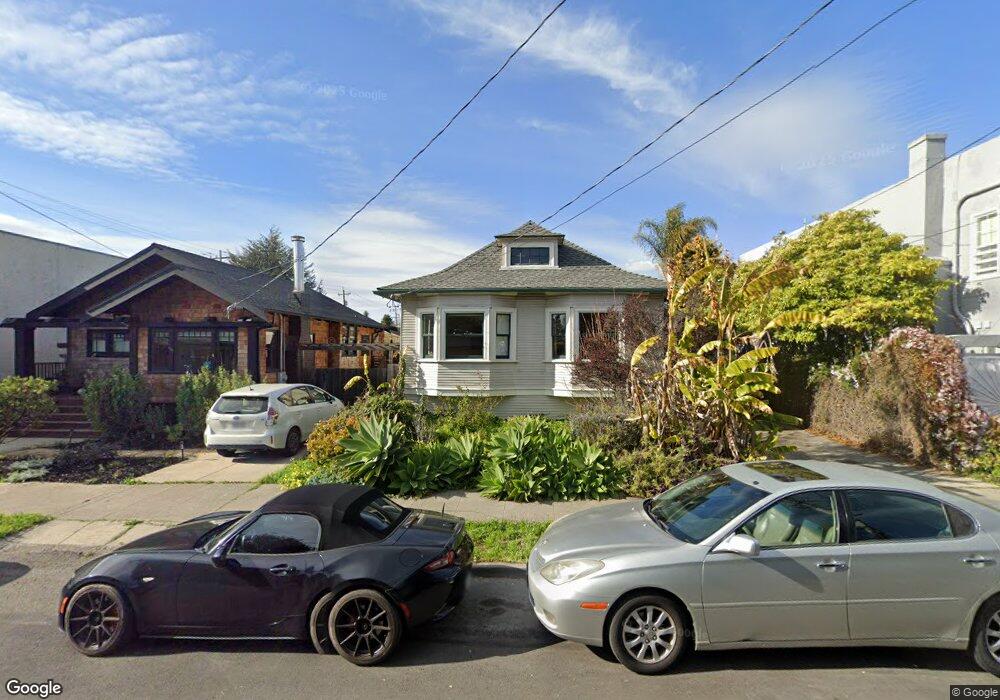
1033 Channing Way Berkeley, CA 94710
West Berkeley NeighborhoodEstimated Value: $931,000 - $1,298,000
2
Beds
1
Bath
1,175
Sq Ft
$916/Sq Ft
Est. Value
About This Home
This home is located at 1033 Channing Way, Berkeley, CA 94710 and is currently estimated at $1,076,452, approximately $916 per square foot. 1033 Channing Way is a home located in Alameda County with nearby schools including Rosa Parks Elementary School, Ruth Acty Elementary, and Berkeley Arts Magnet at Whittier School.
Ownership History
Date
Name
Owned For
Owner Type
Purchase Details
Closed on
May 11, 2001
Sold by
Anson Jeremy S
Bought by
Demarco Marc A
Current Estimated Value
Home Financials for this Owner
Home Financials are based on the most recent Mortgage that was taken out on this home.
Original Mortgage
$190,000
Outstanding Balance
$70,946
Interest Rate
7.03%
Estimated Equity
$1,005,506
Purchase Details
Closed on
Mar 10, 2000
Sold by
Barnett Alston Huey P and Barnett Alston
Bought by
Anson Jeremy S and Demarco Marc A
Home Financials for this Owner
Home Financials are based on the most recent Mortgage that was taken out on this home.
Original Mortgage
$144,000
Interest Rate
8.21%
Create a Home Valuation Report for This Property
The Home Valuation Report is an in-depth analysis detailing your home's value as well as a comparison with similar homes in the area
Home Values in the Area
Average Home Value in this Area
Purchase History
| Date | Buyer | Sale Price | Title Company |
|---|---|---|---|
| Demarco Marc A | -- | Old Republic Title Company | |
| Anson Jeremy S | $180,000 | Fidelity National Title Co |
Source: Public Records
Mortgage History
| Date | Status | Borrower | Loan Amount |
|---|---|---|---|
| Open | Demarco Marc A | $190,000 | |
| Previous Owner | Anson Jeremy S | $144,000 |
Source: Public Records
Tax History
| Year | Tax Paid | Tax Assessment Tax Assessment Total Assessment is a certain percentage of the fair market value that is determined by local assessors to be the total taxable value of land and additions on the property. | Land | Improvement |
|---|---|---|---|---|
| 2025 | $6,276 | $269,634 | $83,020 | $193,614 |
| 2024 | $6,276 | $264,211 | $81,393 | $189,818 |
| 2023 | $6,122 | $265,894 | $79,797 | $186,097 |
| 2022 | $5,960 | $253,682 | $78,233 | $182,449 |
| 2021 | $5,938 | $248,571 | $76,699 | $178,872 |
| 2020 | $5,496 | $252,950 | $75,912 | $177,038 |
| 2019 | $5,144 | $247,991 | $74,424 | $173,567 |
| 2018 | $5,026 | $243,129 | $72,965 | $170,164 |
| 2017 | $4,823 | $238,363 | $71,535 | $166,828 |
| 2016 | $4,573 | $233,690 | $70,132 | $163,558 |
| 2015 | $4,498 | $230,182 | $69,079 | $161,103 |
| 2014 | $4,431 | $225,675 | $67,727 | $157,948 |
Source: Public Records
Map
Nearby Homes
- 1031 Channing Way
- 2337 10th St Unit B
- 2333 10th St
- 2339 10th St Unit D
- 1034 Channing Way
- 1038 Channing Way
- 2401 10th St
- 2331 10th St
- 2407 10th St
- 1019 Channing Way Unit 2
- 1019 Channing Way Unit A
- 1019 Channing Way
- 2362 San Pablo Ave
- 2327 10th St Unit 4
- 2327 10th St Unit 1
- 2327 10th St Unit 2
- 2327 10th St Unit 3
- 2327 10th St
- 2400 10th St
- 2409 10th St
Your Personal Tour Guide
Ask me questions while you tour the home.