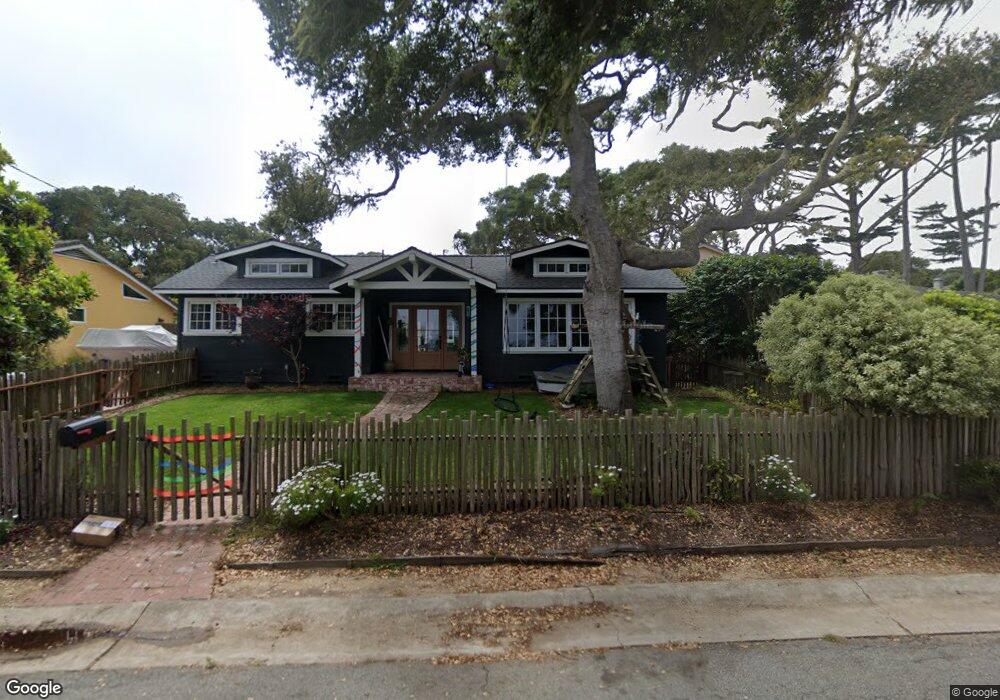
1033 Egan Ave Pacific Grove, CA 93950
Estimated Value: $1,632,000 - $2,161,000
3
Beds
2
Baths
1,678
Sq Ft
$1,081/Sq Ft
Est. Value
About This Home
This home is located at 1033 Egan Ave, Pacific Grove, CA 93950 and is currently estimated at $1,814,093, approximately $1,081 per square foot. 1033 Egan Ave is a home located in Monterey County with nearby schools including Robert Down Elementary School, Pacific Grove Middle School, and Pacific Grove High School.
Ownership History
Date
Name
Owned For
Owner Type
Purchase Details
Closed on
Jan 22, 2021
Sold by
Brubaker Scott and Brubaker Brittany
Bought by
Brubaker Family Trust and Brubaker
Current Estimated Value
Purchase Details
Closed on
Aug 8, 2013
Sold by
Lebeck Barbara Hill
Bought by
Brubaker Scott and Brubaker Brittany
Home Financials for this Owner
Home Financials are based on the most recent Mortgage that was taken out on this home.
Original Mortgage
$483,000
Interest Rate
4.28%
Mortgage Type
New Conventional
Purchase Details
Closed on
Apr 13, 2012
Sold by
Holley Cynthia Ann
Bought by
Holley David R and Holley Cynthia Ann
Purchase Details
Closed on
Jan 1, 2010
Sold by
Lebeck Barbara Hill
Bought by
Lebeck Barbara Hill and Bypass Trust Of The Lebeck Family Trust
Purchase Details
Closed on
Feb 7, 1997
Sold by
Holley Cynthia Ann and Lebeck Charles Gerald
Bought by
Holley Cynthia Ann and Lebeck Charles Gerald
Create a Home Valuation Report for This Property
The Home Valuation Report is an in-depth analysis detailing your home's value as well as a comparison with similar homes in the area
Home Values in the Area
Average Home Value in this Area
Purchase History
| Date | Buyer | Sale Price | Title Company |
|---|---|---|---|
| Brubaker Family Trust | -- | None Listed On Document | |
| Brubaker Scott | $675,000 | Old Republic Title Company | |
| Holley David R | -- | None Available | |
| Lebeck Barbara Hill | -- | None Available | |
| Holley Cynthia Ann | -- | -- |
Source: Public Records
Mortgage History
| Date | Status | Borrower | Loan Amount |
|---|---|---|---|
| Previous Owner | Brubaker Scott | $483,000 |
Source: Public Records
Tax History
| Year | Tax Paid | Tax Assessment Tax Assessment Total Assessment is a certain percentage of the fair market value that is determined by local assessors to be the total taxable value of land and additions on the property. | Land | Improvement |
|---|---|---|---|---|
| 2025 | $11,863 | $1,123,540 | $612,928 | $510,612 |
| 2024 | $11,863 | $1,111,314 | $600,910 | $510,404 |
| 2023 | $11,026 | $1,099,532 | $589,128 | $510,404 |
| 2022 | $9,467 | $987,777 | $577,577 | $410,200 |
| 2021 | $8,571 | $846,252 | $566,252 | $280,000 |
| 2020 | $8,399 | $756,600 | $560,446 | $196,154 |
| 2019 | $8,132 | $741,765 | $549,457 | $192,308 |
| 2018 | $7,971 | $727,222 | $538,684 | $188,538 |
| 2017 | $7,842 | $712,964 | $528,122 | $184,842 |
| 2016 | $7,860 | $698,985 | $517,767 | $181,218 |
| 2015 | $7,734 | $688,486 | $509,990 | $178,496 |
| 2014 | $7,573 | $675,000 | $500,000 | $175,000 |
Source: Public Records
Map
Nearby Homes
- 835 Seapalm Ave
- 1209 Ocean View Blvd
- 715 Mermaid Ave
- 851 Laurel Ave
- 311 Walnut St
- 206 Cypress Ave Unit B
- 700 Briggs Ave Unit 77
- 700 Briggs Ave Unit 83
- 700 Briggs Ave Unit 84
- 302 Park St
- 127 16th St
- 132 Forest Ave
- 224 16th St
- 609 Congress Ave
- 805 Sinex Ave
- 618 Forest Ave
- 313 14th St
- 860 Sunset Dr
- 515 13th St
- 712 Sunset Dr