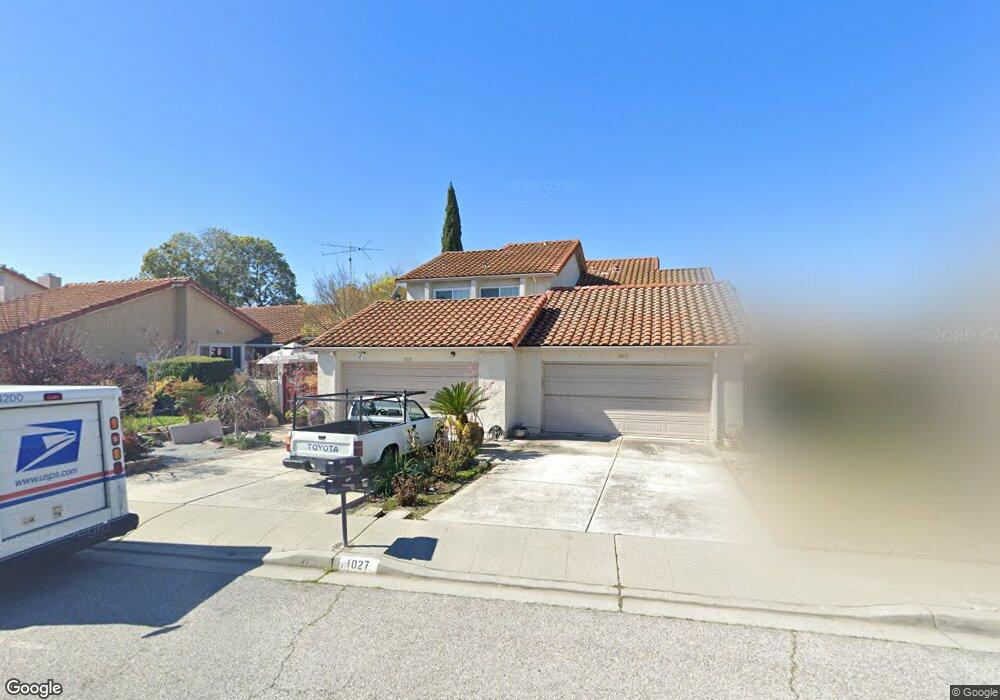
1033 Matterhorn Ct Milpitas, CA 95035
Estimated Value: $1,542,170 - $1,791,000
3
Beds
3
Baths
1,742
Sq Ft
$957/Sq Ft
Est. Value
About This Home
This home is located at 1033 Matterhorn Ct, Milpitas, CA 95035 and is currently estimated at $1,667,043, approximately $956 per square foot. 1033 Matterhorn Ct is a home located in Santa Clara County with nearby schools including John Sinnott Elementary School, Rancho Milpitas Middle School, and Milpitas High School.
Ownership History
Date
Name
Owned For
Owner Type
Purchase Details
Closed on
Nov 1, 2021
Sold by
Le Van T B
Bought by
Le Van T B and The Van T B Le Living Trust
Current Estimated Value
Home Financials for this Owner
Home Financials are based on the most recent Mortgage that was taken out on this home.
Original Mortgage
$372,000
Outstanding Balance
$288,018
Interest Rate
2.15%
Mortgage Type
New Conventional
Estimated Equity
$1,379,025
Purchase Details
Closed on
Jul 25, 2017
Sold by
Le Van and Le Van T B
Bought by
Le Van T B
Purchase Details
Closed on
Jan 16, 2012
Sold by
Nguyen Cuong
Bought by
Le Van
Purchase Details
Closed on
Aug 25, 2006
Sold by
Le Van and Nguyen Tu Hong
Bought by
Le Van
Purchase Details
Closed on
May 12, 2005
Sold by
Tan Andy S and Nguyen Binh T
Bought by
Le Van and Nguyen Tu Hong
Home Financials for this Owner
Home Financials are based on the most recent Mortgage that was taken out on this home.
Original Mortgage
$520,000
Interest Rate
5.1%
Mortgage Type
Negative Amortization
Create a Home Valuation Report for This Property
The Home Valuation Report is an in-depth analysis detailing your home's value as well as a comparison with similar homes in the area
Home Values in the Area
Average Home Value in this Area
Purchase History
| Date | Buyer | Sale Price | Title Company |
|---|---|---|---|
| Le Van T B | -- | Fidelity National Title Co | |
| Le Van T B | -- | Fidelity National Title Co | |
| Le Van T B | -- | Fidelity National Title Co | |
| Le Van T B | -- | None Available | |
| Le Van | -- | None Available | |
| Le Van | -- | None Available | |
| Le Van | -- | Alliance Title Company | |
| Le Van | $650,000 | Alliance Title Company |
Source: Public Records
Mortgage History
| Date | Status | Borrower | Loan Amount |
|---|---|---|---|
| Open | Le Van T B | $372,000 | |
| Previous Owner | Le Van | $520,000 |
Source: Public Records
Tax History Compared to Growth
Tax History
| Year | Tax Paid | Tax Assessment Tax Assessment Total Assessment is a certain percentage of the fair market value that is determined by local assessors to be the total taxable value of land and additions on the property. | Land | Improvement |
|---|---|---|---|---|
| 2025 | $8,924 | $779,575 | $359,802 | $419,773 |
| 2024 | $8,924 | $764,291 | $352,748 | $411,543 |
| 2023 | $8,895 | $749,306 | $345,832 | $403,474 |
| 2022 | $8,941 | $734,614 | $339,051 | $395,563 |
| 2021 | $8,729 | $720,210 | $332,403 | $387,807 |
| 2020 | $8,576 | $712,826 | $328,995 | $383,831 |
| 2019 | $8,478 | $698,850 | $322,545 | $376,305 |
| 2018 | $8,051 | $685,148 | $316,221 | $368,927 |
| 2017 | $7,946 | $671,715 | $310,021 | $361,694 |
| 2016 | $7,624 | $658,545 | $303,943 | $354,602 |
| 2015 | $7,546 | $648,654 | $299,378 | $349,276 |
| 2014 | $7,342 | $635,949 | $293,514 | $342,435 |
Source: Public Records
Map
Nearby Homes
- 1536 Sonoma Dr
- 1710 Clear Lake Ave
- 1612 Tahoe Dr
- 861 Garden St
- 3139 Laneview Dr
- 484 Dempsey Rd Unit 185
- 813 Garden St
- 1455 Cherry Cir
- 496 Dempsey Rd Unit 199
- 1421 Nightshade Rd Unit 31
- 1452 Nightshade Rd Unit 40
- 1435 Nightshade Rd Unit 40
- 621 Clover Cir
- 3108 Kermath Dr
- 2085 Ashwood Ln
- 2075 Lakewood Dr
- 3352 Landess Ave Unit D
- 1501 Canton Dr
- 2327 Farmcrest St
- 2625 Autumnvale Dr
- 1027 Matterhorn Ct
- 1039 Matterhorn Ct
- 1021 Matterhorn Ct
- 1045 Matterhorn Ct
- 1015 Matterhorn Ct
- 1034 Big Bear Ct
- 1040 Big Bear Ct
- 1051 Matterhorn Ct
- 1028 Big Bear Ct
- 1022 Big Bear Ct
- 1046 Big Bear Ct
- 1009 Matterhorn Ct
- 1052 Big Bear Ct
- 1028 Matterhorn Ct
- 1016 Big Bear Ct
- 1034 Matterhorn Ct
- 1057 Matterhorn Ct
- 1022 Matterhorn Ct
- 1016 Matterhorn Ct
- 1322 Mount Shasta Ave