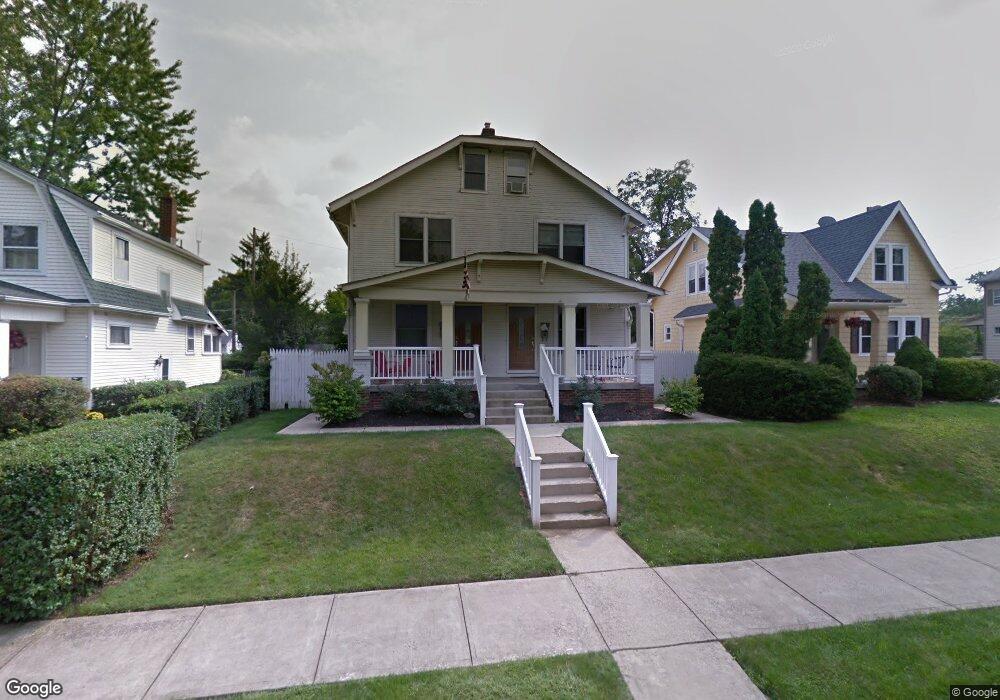
1033 W 2nd Ave Unit TWENTY Columbus, OH 43212
Estimated Value: $230,748 - $448,000
4
Beds
2
Baths
1,404
Sq Ft
$208/Sq Ft
Est. Value
About This Home
This home is located at 1033 W 2nd Ave Unit TWENTY, Columbus, OH 43212 and is currently estimated at $291,937, approximately $207 per square foot. 1033 W 2nd Ave Unit TWENTY is a home located in Franklin County with nearby schools including Robert Louis Stevenson Elementary School, Larson Middle School, and Grandview Heights High School.
Ownership History
Date
Name
Owned For
Owner Type
Purchase Details
Closed on
Dec 3, 2019
Sold by
Dt Investments Of Ohio Llc
Bought by
Salvagna Bruce
Current Estimated Value
Home Financials for this Owner
Home Financials are based on the most recent Mortgage that was taken out on this home.
Original Mortgage
$117,826
Outstanding Balance
$105,163
Interest Rate
4.25%
Mortgage Type
FHA
Estimated Equity
$186,774
Purchase Details
Closed on
May 1, 2019
Sold by
Wilkins Ricardo E
Bought by
Dt Investments Of Ohio Llc
Purchase Details
Closed on
Sep 12, 2000
Sold by
James Mcclamb and James Mary E
Bought by
Wilkins Ricardo E
Home Financials for this Owner
Home Financials are based on the most recent Mortgage that was taken out on this home.
Original Mortgage
$75,250
Interest Rate
8.05%
Mortgage Type
FHA
Purchase Details
Closed on
Aug 13, 1962
Bought by
Mcclamb James and Mcclamb Mary E
Create a Home Valuation Report for This Property
The Home Valuation Report is an in-depth analysis detailing your home's value as well as a comparison with similar homes in the area
Home Values in the Area
Average Home Value in this Area
Purchase History
| Date | Buyer | Sale Price | Title Company |
|---|---|---|---|
| Salvagna Bruce | $120,000 | Monarch Title Services Llc | |
| Dt Investments Of Ohio Llc | $53,000 | Landsel Title Box | |
| Wilkins Ricardo E | $75,300 | Chicago Title West | |
| Mcclamb James | -- | -- |
Source: Public Records
Mortgage History
| Date | Status | Borrower | Loan Amount |
|---|---|---|---|
| Open | Salvagna Bruce | $117,826 | |
| Previous Owner | Wilkins Ricardo E | $75,250 |
Source: Public Records
Tax History Compared to Growth
Tax History
| Year | Tax Paid | Tax Assessment Tax Assessment Total Assessment is a certain percentage of the fair market value that is determined by local assessors to be the total taxable value of land and additions on the property. | Land | Improvement |
|---|---|---|---|---|
| 2024 | $2,641 | $58,840 | $5,780 | $53,060 |
| 2023 | $2,607 | $58,840 | $5,780 | $53,060 |
| 2022 | $2,012 | $38,790 | $3,330 | $35,460 |
| 2021 | $2,015 | $38,790 | $3,330 | $35,460 |
| 2020 | $2,018 | $38,790 | $3,330 | $35,460 |
| 2019 | $1,163 | $18,700 | $2,770 | $15,930 |
| 2018 | $1,045 | $18,700 | $2,770 | $15,930 |
| 2017 | $1,163 | $18,700 | $2,770 | $15,930 |
| 2016 | $1,020 | $15,020 | $3,540 | $11,480 |
| 2015 | $929 | $15,020 | $3,540 | $11,480 |
| 2014 | $931 | $15,020 | $3,540 | $11,480 |
| 2013 | $509 | $16,660 | $3,920 | $12,740 |
Source: Public Records
Map
Nearby Homes
- 1111 Northwest Blvd Unit 113
- 1081 Northwest Blvd Unit 2
- 1081 W 3rd Ave
- 1083 W 3rd Ave
- 1240 Oxley Rd
- 1242 Oxley Rd
- 1093 W 3rd Ave
- 1095 W 3rd Ave
- 1225 Eastview Ave
- 1129 Mulford Rd
- 1297 Doten Ave
- 922 Northwest Blvd
- 910-912 Northwest Blvd
- 932 Mcclain Rd
- 860 Palmer Rd
- 1126 King Ave Unit 128
- 0 Bradley St
- 1475 W 3rd Ave Unit 204
- 537 W 3rd Ave Unit 537
- 506 Riverfront Ln
- 1031 W 2nd Ave Unit 33
- 1039 W 2nd Ave
- 1039 W 2nd Ave Unit TWENTY
- 1025 W 2nd Ave
- 1027 W 2nd Ave Unit TWENTY
- 1021 W 2nd Ave Unit TWENTY
- 1184 Parkway N
- 1015 W 2nd Ave Unit 19
- 1015 W 2nd Ave Unit TWENTY
- 1018 W 2nd Ave Unit TWENTY
- 1015 W 2nd Ave
- 1047 W 2nd Ave Unit 51
- 1047 W 2nd Ave Unit TWENTY
- 1153 Norton Ave
- 1024 W 2nd Ave Unit TWENTY
- 1032 W 2nd Ave
- 1011 W 2nd Ave
- 1026 W 2nd Ave
- 1150 Parkway Dr
- 1038 W 2nd Ave