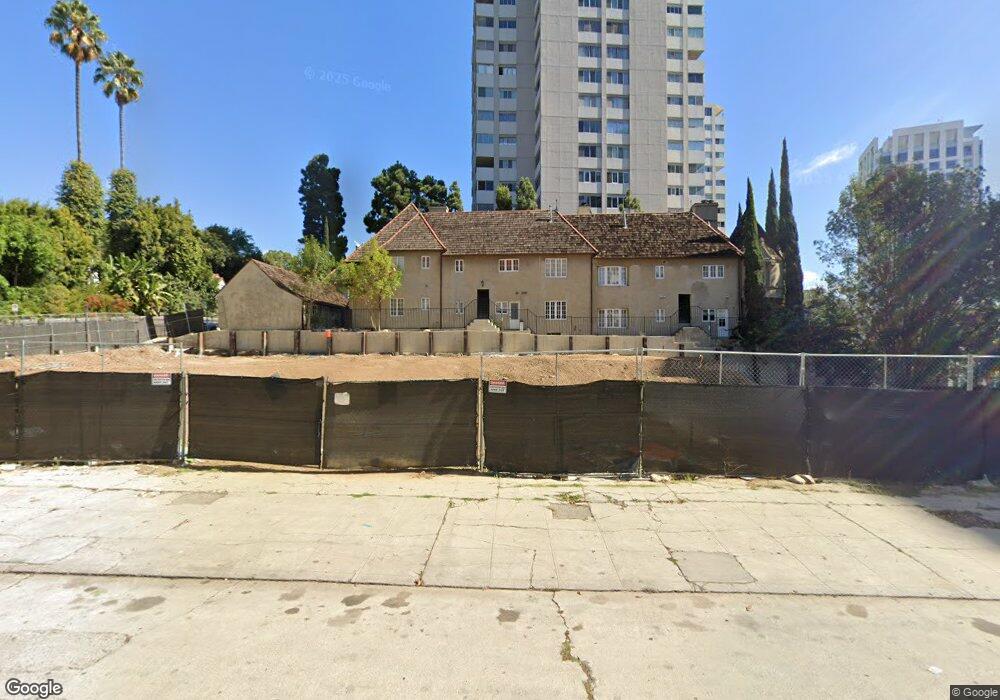
10339 1/2 Wilshire Blvd Los Angeles, CA 90024
Westwood NeighborhoodEstimated Value: $895,732 - $1,224,000
1
Bed
1
Bath
1,035
Sq Ft
$1,055/Sq Ft
Est. Value
About This Home
This home is located at 10339 1/2 Wilshire Blvd, Los Angeles, CA 90024 and is currently estimated at $1,091,933, approximately $1,055 per square foot. 10339 1/2 Wilshire Blvd is a home located in Los Angeles County with nearby schools including Warner Avenue Elementary, Ralph Waldo Emerson Community Charter Middle School, and University High School Charter.
Ownership History
Date
Name
Owned For
Owner Type
Purchase Details
Closed on
Oct 19, 2009
Sold by
Pyle David A
Bought by
Pyle David and David Pyle Trust
Current Estimated Value
Purchase Details
Closed on
Jun 16, 2009
Sold by
Olson Curtis R and Olson Cristine L
Bought by
Pyle David A
Purchase Details
Closed on
Dec 22, 2005
Sold by
Meaney Richard H and Richard Meaney Family Trust
Bought by
Olson Curtis R
Purchase Details
Closed on
Mar 7, 2005
Sold by
Meaney Richard H
Bought by
Meaney Richard H and Richard H Meaney Family Trust
Purchase Details
Closed on
Dec 10, 2004
Sold by
Wilshire Chateau Llc
Bought by
Meaney Richard H
Home Financials for this Owner
Home Financials are based on the most recent Mortgage that was taken out on this home.
Original Mortgage
$480,000
Interest Rate
5.37%
Mortgage Type
Purchase Money Mortgage
Create a Home Valuation Report for This Property
The Home Valuation Report is an in-depth analysis detailing your home's value as well as a comparison with similar homes in the area
Home Values in the Area
Average Home Value in this Area
Purchase History
| Date | Buyer | Sale Price | Title Company |
|---|---|---|---|
| Pyle David | -- | None Available | |
| Pyle David A | -- | First American Title Company | |
| Olson Curtis R | -- | First American Title Company | |
| Meaney Richard H | -- | -- | |
| Meaney Richard H | -- | -- | |
| Meaney Richard H | -- | First American Title Co |
Source: Public Records
Mortgage History
| Date | Status | Borrower | Loan Amount |
|---|---|---|---|
| Previous Owner | Meaney Richard H | $480,000 |
Source: Public Records
Tax History Compared to Growth
Tax History
| Year | Tax Paid | Tax Assessment Tax Assessment Total Assessment is a certain percentage of the fair market value that is determined by local assessors to be the total taxable value of land and additions on the property. | Land | Improvement |
|---|---|---|---|---|
| 2025 | $13,035 | $1,094,584 | $772,651 | $321,933 |
| 2024 | $13,035 | $1,073,122 | $757,501 | $315,621 |
| 2023 | $12,783 | $1,052,082 | $742,649 | $309,433 |
| 2022 | $12,186 | $1,031,454 | $728,088 | $303,366 |
| 2021 | $12,037 | $1,011,230 | $713,812 | $297,418 |
| 2019 | $11,674 | $981,239 | $692,641 | $288,598 |
| 2018 | $11,641 | $962,000 | $679,060 | $282,940 |
| 2016 | $11,140 | $924,647 | $652,693 | $271,954 |
| 2015 | $10,976 | $910,758 | $642,889 | $267,869 |
| 2014 | $11,012 | $892,918 | $630,296 | $262,622 |
Source: Public Records
Map
Nearby Homes
- 10336 Wilshire Blvd Unit 703
- 10350 Wilshire Blvd Unit 702
- 865 Comstock Ave Unit PHD
- 865 Comstock Ave Unit 7F
- 850 Birchwood Dr
- 10380 Wilshire Blvd Unit 404
- 10380 Wilshire Blvd Unit 1703
- 10380 Wilshire Blvd Unit 1501
- 10375 Wilshire Blvd Unit 2F
- 10375 Wilshire Blvd Unit 8F
- 10375 Wilshire Blvd Unit 1B
- 10370 Ashton Ave
- 1250 S Beverly Glen Blvd Unit 107
- 10301 Strathmore Dr
- 1260 S Beverly Glen Blvd Unit 408
- 10430 Wilshire Blvd Unit 1705
- 10430 Wilshire Blvd Unit 1405
- 10430 Wilshire Blvd Unit 302
- 10430 Wilshire Blvd Unit 802
- 10430 Wilshire Blvd Unit 1005
- 10341 1/2 Wilshire Blvd
- 10337 1/2 Wilshire Blvd
- 10337 Wilshire Blvd
- 10339 Wilshire Blvd
- 10335 1/2 Wilshire Blvd
- 10341 Wilshire Blvd
- 860 Devon Ave
- 850 Devon Ave
- 865 Comstock Ave Unit 6F
- 865 Comstock Ave
- 865 Comstock Ave Unit 7A
- 865 Comstock Ave Unit 11B
- 865 Comstock Ave Unit 11F
- 865 Comstock Ave Unit 4A
- 865 Comstock Ave Unit PHD
- 865 Comstock Ave Unit 8E
- 865 Comstock Ave Unit 16D
- 865 Comstock Ave Unit 12C
- 865 Comstock Ave Unit 16B
- 865 Comstock Ave Unit 17C