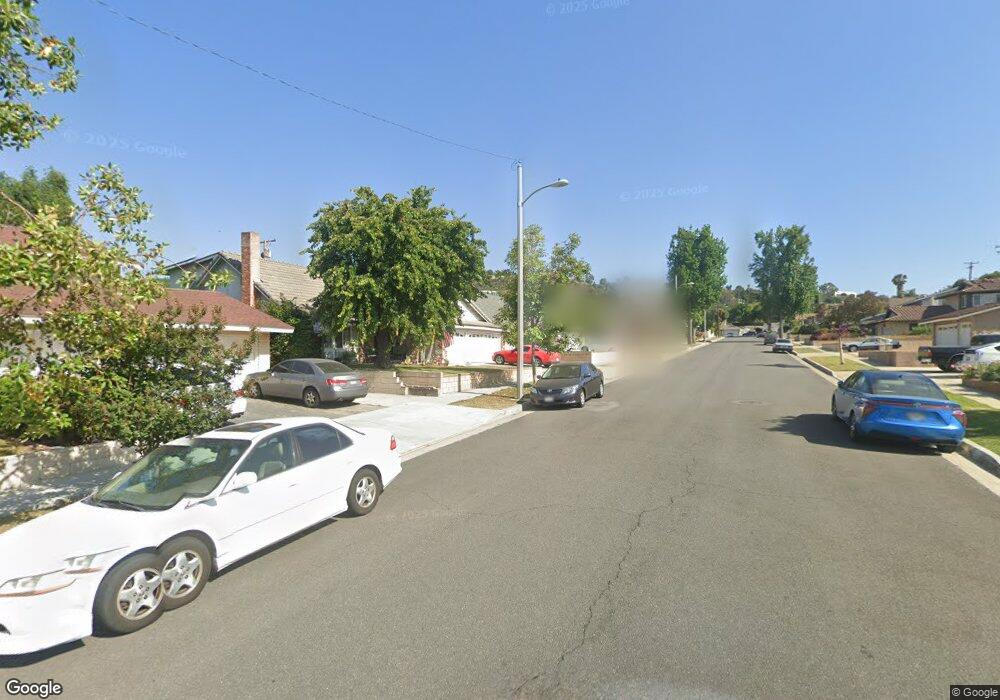
1034 Capen Ave Walnut, CA 91789
Estimated Value: $1,103,825 - $1,237,000
4
Beds
3
Baths
2,442
Sq Ft
$480/Sq Ft
Est. Value
About This Home
This home is located at 1034 Capen Ave, Walnut, CA 91789 and is currently estimated at $1,171,956, approximately $479 per square foot. 1034 Capen Ave is a home located in Los Angeles County with nearby schools including Walnut Elementary School, South Pointe Middle School, and Diamond Bar High School.
Ownership History
Date
Name
Owned For
Owner Type
Purchase Details
Closed on
Jan 30, 2020
Sold by
Sheng Wei Young and Hwang Ling Yi
Bought by
Sheng Wei Young and Hwang Ling Yi
Current Estimated Value
Purchase Details
Closed on
Oct 24, 2011
Sold by
Tu Lorica
Bought by
Sheng Wei Young and Hwang Ling Yi
Purchase Details
Closed on
May 31, 2000
Sold by
Hahn Jill
Bought by
Tu Lorica
Home Financials for this Owner
Home Financials are based on the most recent Mortgage that was taken out on this home.
Original Mortgage
$275,000
Interest Rate
12.5%
Mortgage Type
Stand Alone First
Purchase Details
Closed on
Apr 24, 2000
Sold by
Hahn Richard
Bought by
Hahn Jill
Home Financials for this Owner
Home Financials are based on the most recent Mortgage that was taken out on this home.
Original Mortgage
$275,000
Interest Rate
12.5%
Mortgage Type
Stand Alone First
Create a Home Valuation Report for This Property
The Home Valuation Report is an in-depth analysis detailing your home's value as well as a comparison with similar homes in the area
Home Values in the Area
Average Home Value in this Area
Purchase History
| Date | Buyer | Sale Price | Title Company |
|---|---|---|---|
| Sheng Wei Young | -- | None Available | |
| Sheng Wei Young | $482,000 | Fatcola | |
| Tu Lorica | $275,000 | -- | |
| Hahn Jill | -- | -- | |
| Hahn Jill | -- | -- |
Source: Public Records
Mortgage History
| Date | Status | Borrower | Loan Amount |
|---|---|---|---|
| Previous Owner | Tu Lorica | $275,000 |
Source: Public Records
Tax History
| Year | Tax Paid | Tax Assessment Tax Assessment Total Assessment is a certain percentage of the fair market value that is determined by local assessors to be the total taxable value of land and additions on the property. | Land | Improvement |
|---|---|---|---|---|
| 2025 | $7,571 | $605,410 | $426,930 | $178,480 |
| 2024 | $7,571 | $593,540 | $418,559 | $174,981 |
| 2023 | $7,393 | $581,902 | $410,352 | $171,550 |
| 2022 | $7,240 | $570,493 | $402,306 | $168,187 |
| 2021 | $7,101 | $559,308 | $394,418 | $164,890 |
| 2019 | $6,879 | $542,720 | $382,720 | $160,000 |
| 2018 | $6,593 | $532,079 | $375,216 | $156,863 |
| 2016 | $6,103 | $511,420 | $360,647 | $150,773 |
| 2015 | $6,139 | $503,739 | $355,230 | $148,509 |
| 2014 | $6,147 | $493,872 | $348,272 | $145,600 |
Source: Public Records
Map
Nearby Homes
- 21249 Davan St
- 21039 Glenwold Dr
- 21284 Lycoming St
- 779 Summerwood Ave
- 826 Silver Fir Rd
- 21203 Fibre Ct
- 720 Windwood Dr Unit 145
- 1509 Sapphire Ln
- 21217 E Washington Unit 32
- 21217 E Washington Unit 113
- 1571 Sapphire Ln
- 22105 Birds Eye Dr
- 20739 Lycoming St Unit 35
- 21415 Running River Ct
- 1728 Shadehill Place
- 1389 S Lemon Ave
- 1522 Sunbluff Dr
- 1700 Fern Hollow Dr
- 1554 Deerfoot Dr
- 1508 Gide Ct
Your Personal Tour Guide
Ask me questions while you tour the home.