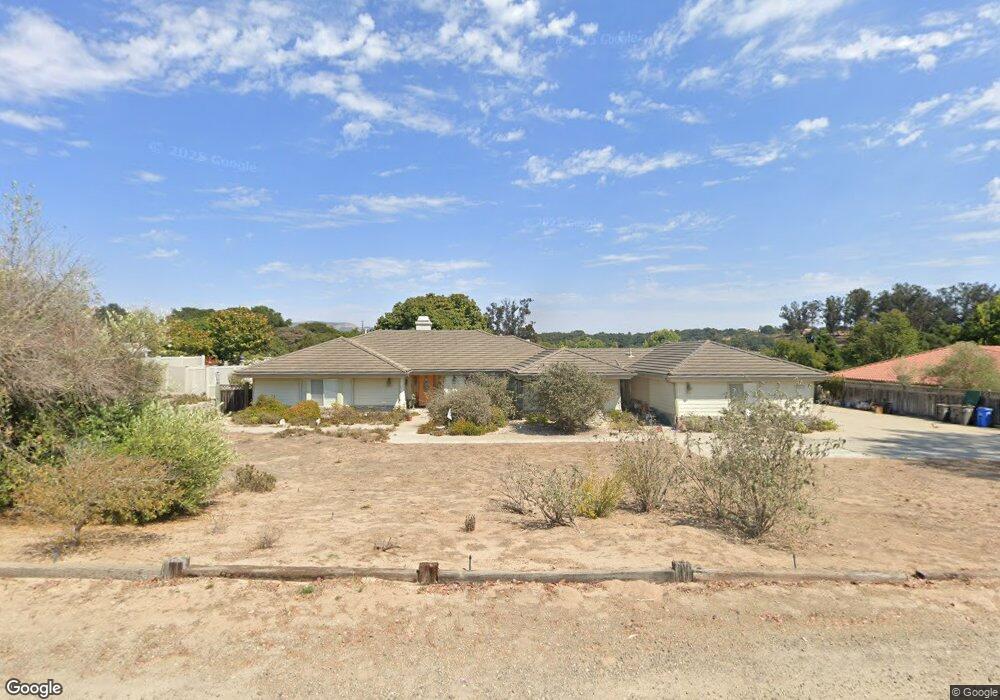
1035 Olympic Way Nipomo, CA 93444
Estimated Value: $1,282,000 - $1,542,000
4
Beds
4
Baths
3,093
Sq Ft
$447/Sq Ft
Est. Value
About This Home
This home is located at 1035 Olympic Way, Nipomo, CA 93444 and is currently estimated at $1,381,668, approximately $446 per square foot. 1035 Olympic Way is a home located in San Luis Obispo County with nearby schools including Dana Elementary School, Mesa Middle School, and Nipomo High School.
Ownership History
Date
Name
Owned For
Owner Type
Purchase Details
Closed on
Nov 19, 1998
Sold by
Nester Greg
Bought by
Moreno Shirley Ann
Current Estimated Value
Home Financials for this Owner
Home Financials are based on the most recent Mortgage that was taken out on this home.
Original Mortgage
$234,900
Outstanding Balance
$52,719
Interest Rate
6.91%
Estimated Equity
$1,328,949
Purchase Details
Closed on
Aug 18, 1998
Sold by
Nester Kimberly Ann
Bought by
Nestor Greg
Home Financials for this Owner
Home Financials are based on the most recent Mortgage that was taken out on this home.
Original Mortgage
$252,000
Interest Rate
6.91%
Mortgage Type
Construction
Create a Home Valuation Report for This Property
The Home Valuation Report is an in-depth analysis detailing your home's value as well as a comparison with similar homes in the area
Home Values in the Area
Average Home Value in this Area
Purchase History
| Date | Buyer | Sale Price | Title Company |
|---|---|---|---|
| Moreno Shirley Ann | $380,000 | First American Title | |
| Nestor Greg | -- | First American Title Ins Co | |
| Nester Greg | $65,000 | First American Title Ins Co |
Source: Public Records
Mortgage History
| Date | Status | Borrower | Loan Amount |
|---|---|---|---|
| Open | Moreno Shirley Ann | $234,900 | |
| Previous Owner | Nestor Greg | $252,000 | |
| Closed | Nestor Greg | $65,000 |
Source: Public Records
Tax History
| Year | Tax Paid | Tax Assessment Tax Assessment Total Assessment is a certain percentage of the fair market value that is determined by local assessors to be the total taxable value of land and additions on the property. | Land | Improvement |
|---|---|---|---|---|
| 2025 | $6,126 | $595,553 | $203,791 | $391,762 |
| 2024 | $6,056 | $583,877 | $199,796 | $384,081 |
| 2023 | $6,056 | $572,429 | $195,879 | $376,550 |
| 2022 | $5,964 | $561,206 | $192,039 | $369,167 |
| 2021 | $5,953 | $550,203 | $188,274 | $361,929 |
| 2020 | $5,885 | $544,562 | $186,344 | $358,218 |
| 2019 | $5,849 | $533,886 | $182,691 | $351,195 |
| 2018 | $5,780 | $523,418 | $179,109 | $344,309 |
| 2017 | $5,671 | $513,156 | $175,598 | $337,558 |
| 2016 | $5,349 | $503,095 | $172,155 | $330,940 |
| 2015 | $5,272 | $495,539 | $169,570 | $325,969 |
| 2014 | -- | $485,833 | $166,249 | $319,584 |
Source: Public Records
Map
Nearby Homes
- 1089 Olympic Way
- 680 Sweet Donna Place
- 12 Oakglen S
- 770 & 772 Beverly
- 182 172 E Chestnut
- 760 Black Oak Ln
- 940 Calle Fresa
- 1093 Camino Caballo
- 219 Lema Dr
- 745 Inga Rd
- 850 Primrose Ln
- 250 Via Promesa
- 778 Primrose Ln
- 228 Chaparral Ln
- 340 N Las Flores Dr
- 161 Lot Scenic View Way
- 0 Scenic View Way
- 341 N Las Flores Dr
- 270 S Tejas Place
- 1060 Dawn Rd
- 1025 Olympic Way
- 1049 Olympic Way
- 1040 Olympic Way
- 1030 Olympic Way
- 1015 Olympic Way
- 1055 Olympic Way
- 1020 Olympic Way
- 1048 Olympic Way
- 1030 La Serenata Way
- 1020 La Serenata Way
- 1061 Olympic Way
- 1010 Olympic Way
- 1040 La Serenata Way
- 1058 Olympic Way
- 1050 La Serenata Way
- 1010 La Serenata Way
- 995 Olympic Way
- 1066 Olympic Way
- 1071 Olympic Way
- 1035 George Way
Your Personal Tour Guide
Ask me questions while you tour the home.