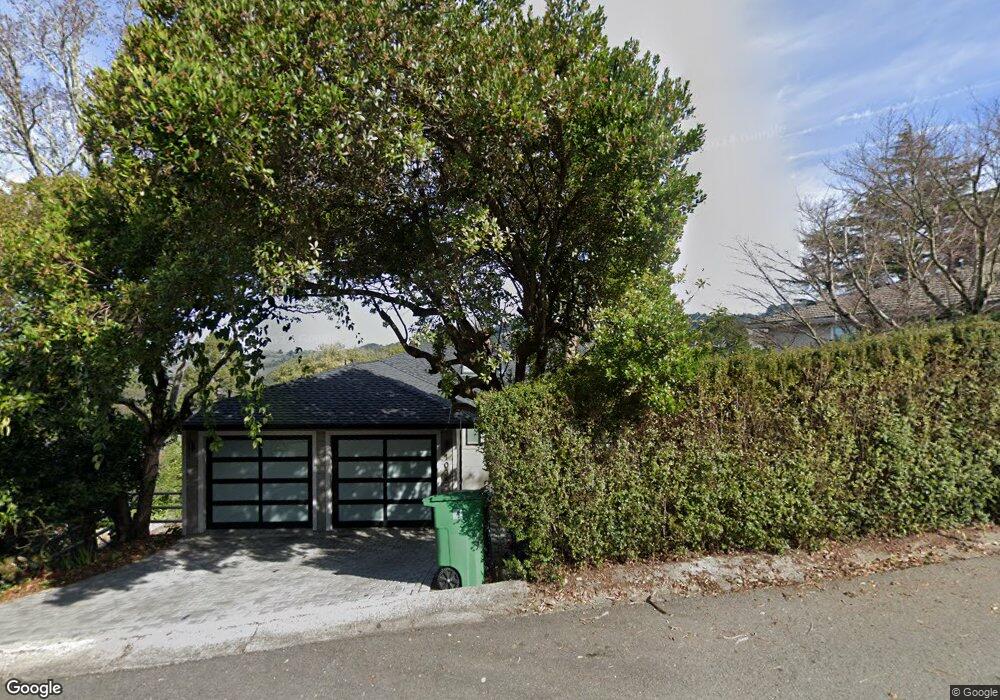
1035 Overlook Rd Berkeley, CA 94708
Berkeley Hills NeighborhoodEstimated Value: $2,082,000 - $2,529,194
4
Beds
4
Baths
3,348
Sq Ft
$683/Sq Ft
Est. Value
About This Home
This home is located at 1035 Overlook Rd, Berkeley, CA 94708 and is currently estimated at $2,286,799, approximately $683 per square foot. 1035 Overlook Rd is a home located in Alameda County with nearby schools including Cragmont Elementary School, Berkeley Arts Magnet at Whittier School, and Washington Elementary School.
Ownership History
Date
Name
Owned For
Owner Type
Purchase Details
Closed on
Jun 24, 2021
Sold by
Lim Zoe and Glynn Dominic
Bought by
Lim Zoe and Glynn Dominic
Current Estimated Value
Purchase Details
Closed on
May 2, 2016
Sold by
Golden Road Inc
Bought by
Glynn Dominic and Lim Zoe M
Home Financials for this Owner
Home Financials are based on the most recent Mortgage that was taken out on this home.
Original Mortgage
$625,500
Outstanding Balance
$498,751
Interest Rate
3.71%
Mortgage Type
New Conventional
Estimated Equity
$1,788,048
Purchase Details
Closed on
Jun 25, 2015
Sold by
Ford Gregory R and Noel Donna
Bought by
Golden Road Inc
Home Financials for this Owner
Home Financials are based on the most recent Mortgage that was taken out on this home.
Original Mortgage
$900,000
Interest Rate
3.81%
Mortgage Type
Purchase Money Mortgage
Create a Home Valuation Report for This Property
The Home Valuation Report is an in-depth analysis detailing your home's value as well as a comparison with similar homes in the area
Home Values in the Area
Average Home Value in this Area
Purchase History
| Date | Buyer | Sale Price | Title Company |
|---|---|---|---|
| Lim Zoe | -- | None Available | |
| Glynn Dominic | $1,692,000 | First American Title Company | |
| Golden Road Inc | $917,000 | First American Title Company |
Source: Public Records
Mortgage History
| Date | Status | Borrower | Loan Amount |
|---|---|---|---|
| Open | Glynn Dominic | $625,500 | |
| Previous Owner | Golden Road Inc | $900,000 |
Source: Public Records
Tax History
| Year | Tax Paid | Tax Assessment Tax Assessment Total Assessment is a certain percentage of the fair market value that is determined by local assessors to be the total taxable value of land and additions on the property. | Land | Improvement |
|---|---|---|---|---|
| 2025 | $29,250 | $1,995,583 | $532,696 | $1,469,887 |
| 2024 | $29,250 | $1,956,319 | $522,252 | $1,441,067 |
| 2023 | $28,606 | $1,924,832 | $512,014 | $1,412,818 |
| 2022 | $28,077 | $1,880,091 | $501,975 | $1,385,116 |
| 2021 | $28,177 | $1,843,093 | $492,133 | $1,357,960 |
| 2020 | $26,781 | $1,831,129 | $487,089 | $1,344,040 |
| 2019 | $25,852 | $1,795,232 | $477,540 | $1,317,692 |
| 2018 | $25,272 | $1,760,044 | $468,180 | $1,291,864 |
| 2017 | $24,596 | $1,725,534 | $459,000 | $1,266,534 |
| 2016 | $14,554 | $917,000 | $350,000 | $567,000 |
| 2015 | $4,466 | $102,353 | $33,332 | $69,021 |
| 2014 | -- | $100,348 | $32,679 | $67,669 |
Source: Public Records
Map
Nearby Homes
- 1085 Creston Rd
- 1024 Grizzly Peak Blvd
- 1110 Sterling Ave
- 935 Grizzly Peak Blvd
- 1160 Miller Ave
- 1155 Keeler Ave
- 1165 Cragmont Ave
- 1106 Cragmont Ave
- 962 Regal Rd
- 730 Wildcat Canyon Rd
- 1221 Grizzly Peak Blvd
- 1004 Cragmont Ave
- 2686 Shasta Rd
- 1375 Queens Rd
- 777 Cragmont Ave
- 938 San Benito Rd
- 2315 Eunice St
- 758 Spruce St
- 606 Grizzly Peak Blvd
- 230 Fairlawn Dr
- 1039 Overlook Rd
- 1038 Middlefield Rd
- 1033 Overlook Rd
- 1042 Middlefield Rd
- 1034 Middlefield Rd
- 1043 Overlook Rd
- 1044 Overlook Rd
- 1050 Overlook Rd
- 1046 Middlefield Rd
- 1040 Overlook Rd
- 1040 Overlook Rd
- 1030 Middlefield Rd
- 1047 Overlook Rd
- 1052 Overlook Rd
- 1033 Middlefield Rd
- 1032 Overlook Rd
- 1044 Park Hills Rd
- 1050 Middlefield Rd
- 1019 Overlook Rd
- 1028 Middlefield Rd
Your Personal Tour Guide
Ask me questions while you tour the home.