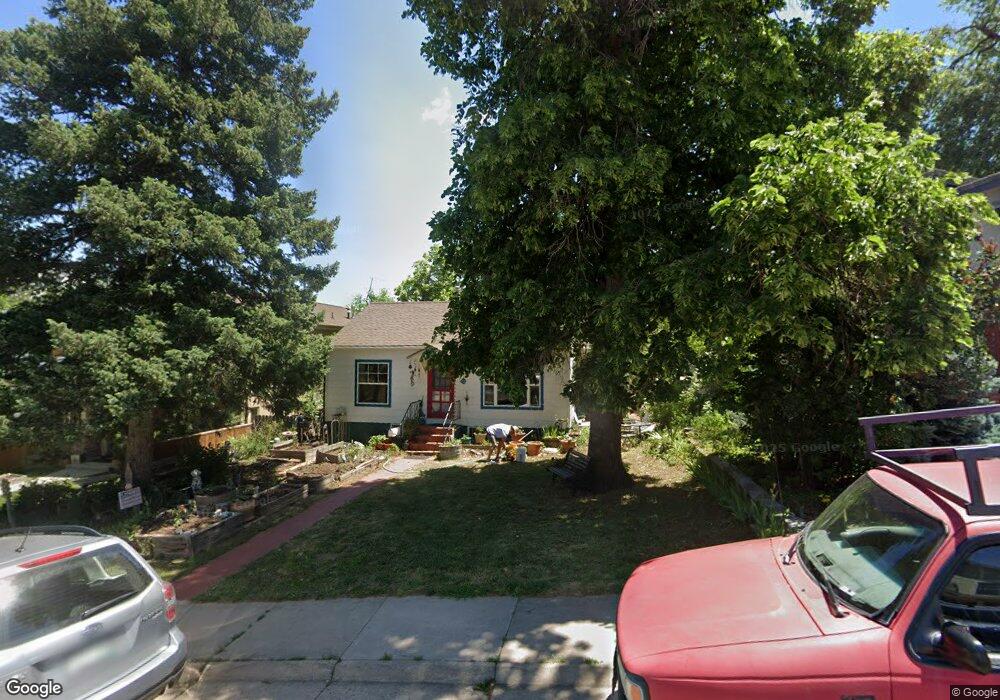
1036 8th St Boulder, CO 80302
University Hill NeighborhoodEstimated Value: $1,203,000 - $1,717,000
2
Beds
2
Baths
1,415
Sq Ft
$975/Sq Ft
Est. Value
About This Home
This home is located at 1036 8th St, Boulder, CO 80302 and is currently estimated at $1,380,175, approximately $975 per square foot. 1036 8th St is a home located in Boulder County with nearby schools including Flatirons Elementary School, Manhattan Middle School of the Arts & Academics, and Boulder High School.
Ownership History
Date
Name
Owned For
Owner Type
Purchase Details
Closed on
Feb 14, 1997
Sold by
Kropf Robert L
Bought by
Smith David Paul
Current Estimated Value
Home Financials for this Owner
Home Financials are based on the most recent Mortgage that was taken out on this home.
Original Mortgage
$178,500
Outstanding Balance
$20,398
Interest Rate
7.68%
Estimated Equity
$1,359,777
Purchase Details
Closed on
Jun 26, 1992
Bought by
Smith David Paul
Purchase Details
Closed on
May 26, 1992
Bought by
Smith David Paul
Purchase Details
Closed on
Feb 13, 1985
Bought by
Smith David Paul
Create a Home Valuation Report for This Property
The Home Valuation Report is an in-depth analysis detailing your home's value as well as a comparison with similar homes in the area
Home Values in the Area
Average Home Value in this Area
Purchase History
| Date | Buyer | Sale Price | Title Company |
|---|---|---|---|
| Smith David Paul | $210,000 | Heritage Title | |
| Smith David Paul | $25,200 | -- | |
| Smith David Paul | -- | -- | |
| Smith David Paul | -- | -- |
Source: Public Records
Mortgage History
| Date | Status | Borrower | Loan Amount |
|---|---|---|---|
| Open | Smith David Paul | $178,500 |
Source: Public Records
Tax History
| Year | Tax Paid | Tax Assessment Tax Assessment Total Assessment is a certain percentage of the fair market value that is determined by local assessors to be the total taxable value of land and additions on the property. | Land | Improvement |
|---|---|---|---|---|
| 2025 | $7,211 | $87,426 | $78,683 | $8,743 |
| 2024 | $7,211 | $87,426 | $78,683 | $8,743 |
| 2023 | $7,086 | $88,748 | $83,190 | $9,243 |
| 2022 | $6,456 | $76,471 | $68,824 | $7,647 |
| 2021 | $6,772 | $78,671 | $70,804 | $7,867 |
| 2020 | $6,083 | $69,884 | $60,346 | $9,538 |
| 2019 | $5,990 | $69,884 | $60,346 | $9,538 |
| 2018 | $5,736 | $66,161 | $46,872 | $19,289 |
| 2017 | $5,557 | $73,145 | $51,820 | $21,325 |
| 2016 | $4,527 | $52,297 | $31,362 | $20,935 |
| 2015 | $4,287 | $44,894 | $23,004 | $21,890 |
| 2014 | $3,775 | $44,894 | $23,004 | $21,890 |
Source: Public Records
Map
Nearby Homes
- 964 Grant Place
- 1021 9th St
- 780 College Ave
- 911 Lincoln Place
- 505 Geneva Ave
- 1128 Lincoln Place
- 820 6th St
- 800 Grant Place
- 611 Cascade Ave Unit 7
- 972 Pleasant St
- 920 University Ave
- 751 Grant Place
- 610 University Ave
- 440 Christmas Tree Dr
- 770 Circle Dr
- 839 13th St
- 623 Marine St
- 1405 Broadway St Unit 307
- 1405 Broadway St Unit 206
- 1405 Broadway St Unit 102
Your Personal Tour Guide
Ask me questions while you tour the home.