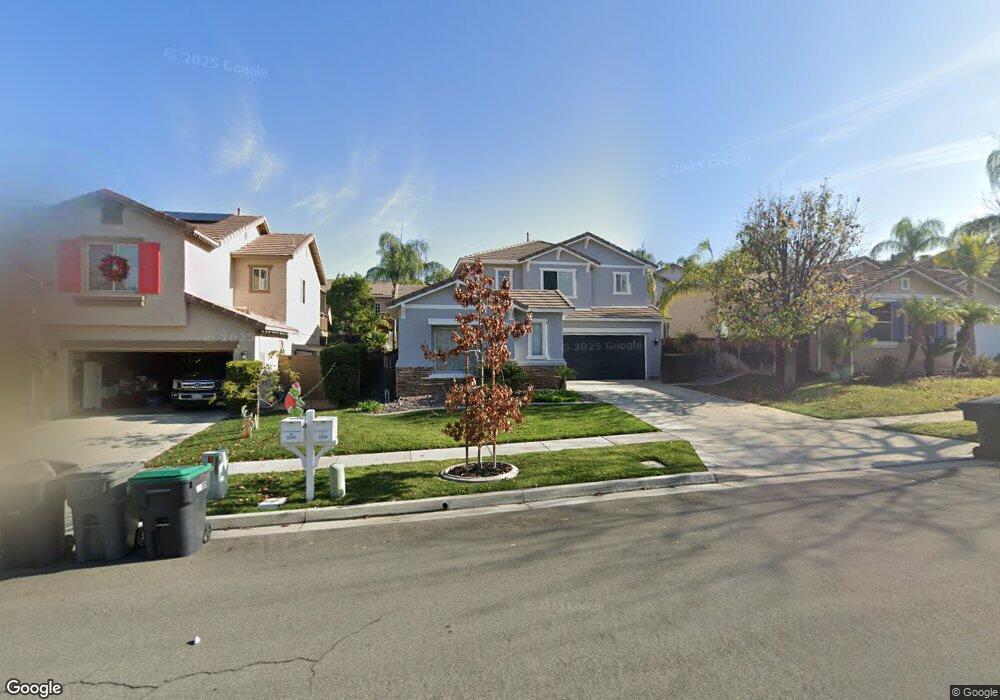
1036 Bainbridge Cir Unit 20 Corona, CA 92882
South Corona NeighborhoodEstimated Value: $782,000 - $824,000
3
Beds
3
Baths
2,187
Sq Ft
$368/Sq Ft
Est. Value
About This Home
This home is located at 1036 Bainbridge Cir Unit 20, Corona, CA 92882 and is currently estimated at $804,633, approximately $367 per square foot. 1036 Bainbridge Cir Unit 20 is a home located in Riverside County with nearby schools including Dwight D. Eisenhower Elementary School, Citrus Hills Intermediate School, and Santiago High School.
Ownership History
Date
Name
Owned For
Owner Type
Purchase Details
Closed on
Jul 10, 2025
Sold by
Maldonado Richard C and Maldonado Verna L
Bought by
Maldonado Family Trust and Maldonado
Current Estimated Value
Purchase Details
Closed on
Oct 14, 2010
Sold by
Maldonado Richard C and Maldonado Verna L
Bought by
Maldonado Richard C and Maldonado Verna L
Home Financials for this Owner
Home Financials are based on the most recent Mortgage that was taken out on this home.
Original Mortgage
$120,000
Interest Rate
4.16%
Mortgage Type
New Conventional
Purchase Details
Closed on
Aug 4, 2004
Sold by
Maldonado Richard C and Maldonado Verna L
Bought by
Maldonado Richard C and Maldonado Verna L
Purchase Details
Closed on
May 6, 1999
Sold by
Centex Homes
Bought by
Maldonado Richard C and Maldonado Verna L
Home Financials for this Owner
Home Financials are based on the most recent Mortgage that was taken out on this home.
Original Mortgage
$199,700
Interest Rate
7.63%
Mortgage Type
Purchase Money Mortgage
Create a Home Valuation Report for This Property
The Home Valuation Report is an in-depth analysis detailing your home's value as well as a comparison with similar homes in the area
Home Values in the Area
Average Home Value in this Area
Purchase History
| Date | Buyer | Sale Price | Title Company |
|---|---|---|---|
| Maldonado Family Trust | -- | None Listed On Document | |
| Maldonado Richard C | -- | Ticor Title Company Of Ca | |
| Maldonado Richard C | -- | -- | |
| Maldonado Richard C | $210,500 | Fidelity National Title |
Source: Public Records
Mortgage History
| Date | Status | Borrower | Loan Amount |
|---|---|---|---|
| Previous Owner | Maldonado Richard C | $120,000 | |
| Previous Owner | Maldonado Richard C | $199,700 |
Source: Public Records
Tax History Compared to Growth
Tax History
| Year | Tax Paid | Tax Assessment Tax Assessment Total Assessment is a certain percentage of the fair market value that is determined by local assessors to be the total taxable value of land and additions on the property. | Land | Improvement |
|---|---|---|---|---|
| 2025 | $4,218 | $344,768 | $76,834 | $267,934 |
| 2023 | $4,218 | $331,382 | $73,851 | $257,531 |
| 2022 | $4,464 | $324,885 | $72,403 | $252,482 |
| 2021 | $4,390 | $318,516 | $70,984 | $247,532 |
| 2020 | $4,357 | $315,251 | $70,257 | $244,994 |
| 2019 | $4,362 | $309,071 | $68,880 | $240,191 |
| 2018 | $4,622 | $303,012 | $67,531 | $235,481 |
| 2017 | $4,542 | $297,071 | $66,207 | $230,864 |
| 2016 | $4,500 | $291,247 | $64,909 | $226,338 |
| 2015 | $4,427 | $286,874 | $63,935 | $222,939 |
| 2014 | $4,330 | $281,257 | $62,684 | $218,573 |
Source: Public Records
Map
Nearby Homes
- 3231 Hannover St
- 3133 Windhaven Way Unit 50
- 1153 Archer Cir Unit 89
- 832 Carolina Cir
- 3141 Brunstane Cir
- 1066 Royal Oaks Cir
- 2898 Briarhaven Ln
- 935 Rustlers Way
- 3933 Malaga St
- 2775 S Buena Vista Ave
- 341 Kilworth Dr
- 675 Avenida Terrazo
- 2775 Canyon View Cir
- 3384 Amethyst St
- 825 Derby St
- 197 Lydia Ln
- 2621 Grove Ave
- 1185 Bridgeport Rd
- 2714 Peachwood Cir
- 3090 Mangular Ave
- 1030 Bainbridge Cir
- 1042 Bainbridge Cir
- 1031 Regina Way
- 1025 Regina Way Unit 11
- 1037 Regina Way
- 1024 Bainbridge Cir
- 1048 Bainbridge Cir Unit 22
- 1019 Regina Way
- 1043 Regina Way
- 1018 Bainbridge Cir
- 1041 Bainbridge Cir
- 1029 Bainbridge Cir
- 1023 Bainbridge Cir Unit 35
- 1035 Bainbridge Cir
- 1054 Bainbridge Cir
- 1047 Bainbridge Cir
- 1013 Regina Way
- 1060 Bainbridge Cir
- 1012 Bainbridge Cir
- 1055 Regina Way