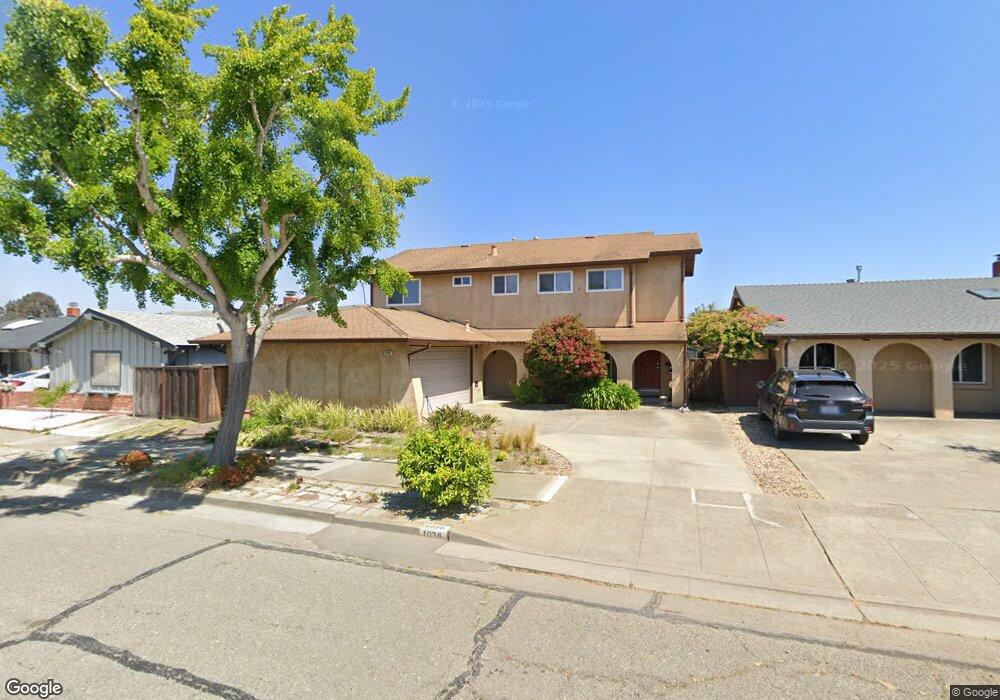
1036 Camellia Dr Alameda, CA 94502
Harbor Bay/Bay Farm NeighborhoodEstimated Value: $1,477,000 - $1,798,117
5
Beds
4
Baths
2,728
Sq Ft
$593/Sq Ft
Est. Value
About This Home
This home is located at 1036 Camellia Dr, Alameda, CA 94502 and is currently estimated at $1,619,029, approximately $593 per square foot. 1036 Camellia Dr is a home located in Alameda County with nearby schools including Amelia Earhart Elementary School, Lincoln Middle School, and Alameda High School.
Ownership History
Date
Name
Owned For
Owner Type
Purchase Details
Closed on
Oct 23, 2023
Sold by
Biroc Sandra L
Bought by
Biroc Sandra L and Unger Daniel B
Current Estimated Value
Purchase Details
Closed on
Oct 24, 2001
Sold by
Biroc Sandra Lyn
Bought by
Biroc Sandra Lyn
Home Financials for this Owner
Home Financials are based on the most recent Mortgage that was taken out on this home.
Original Mortgage
$238,000
Interest Rate
6.84%
Purchase Details
Closed on
Jul 6, 1999
Sold by
Carter Tandy W and Carter Caroline J
Bought by
Biroc Sandra Lyn
Home Financials for this Owner
Home Financials are based on the most recent Mortgage that was taken out on this home.
Original Mortgage
$316,800
Interest Rate
7.4%
Purchase Details
Closed on
Oct 21, 1994
Sold by
Carter Tandy W and Carter Caroline J
Bought by
Carter Tandy W and Carter Caroline J
Create a Home Valuation Report for This Property
The Home Valuation Report is an in-depth analysis detailing your home's value as well as a comparison with similar homes in the area
Home Values in the Area
Average Home Value in this Area
Purchase History
| Date | Buyer | Sale Price | Title Company |
|---|---|---|---|
| Biroc Sandra L | -- | None Listed On Document | |
| Biroc Sandra Lyn | -- | Fidelity National Title Co | |
| Biroc Sandra Lyn | $396,000 | Placer Title Company | |
| Biroc Sandra Lyn | -- | Placer Title Company | |
| Carter Tandy W | -- | -- |
Source: Public Records
Mortgage History
| Date | Status | Borrower | Loan Amount |
|---|---|---|---|
| Previous Owner | Biroc Sandra Lyn | $238,000 | |
| Previous Owner | Biroc Sandra Lyn | $316,800 |
Source: Public Records
Tax History Compared to Growth
Tax History
| Year | Tax Paid | Tax Assessment Tax Assessment Total Assessment is a certain percentage of the fair market value that is determined by local assessors to be the total taxable value of land and additions on the property. | Land | Improvement |
|---|---|---|---|---|
| 2025 | $9,983 | $601,607 | $182,582 | $426,025 |
| 2024 | $9,983 | $589,676 | $179,003 | $417,673 |
| 2023 | $9,636 | $577,978 | $175,493 | $409,485 |
| 2022 | $9,436 | $566,510 | $172,053 | $401,457 |
| 2021 | $9,227 | $555,267 | $168,680 | $393,587 |
| 2020 | $9,127 | $556,506 | $166,952 | $389,554 |
| 2019 | $8,321 | $545,596 | $163,679 | $381,917 |
| 2018 | $8,123 | $534,900 | $160,470 | $374,430 |
| 2017 | $7,777 | $524,414 | $157,324 | $367,090 |
| 2016 | $7,781 | $514,134 | $154,240 | $359,894 |
| 2015 | $7,750 | $506,411 | $151,923 | $354,488 |
| 2014 | $7,376 | $496,492 | $148,947 | $347,545 |
Source: Public Records
Map
Nearby Homes
- 1031 Camellia Dr
- 1042 Jost Ln
- 1078 Jost Ln
- 133 Mecartney Rd
- 1083 Melrose Ave
- 3308 Fir Ave
- 3315 Willis Ln
- 3337 Solomon Ln
- 127 Maitland Dr
- 3344 Solomon Ln
- 3334 Solomon Ln
- 1142 Holly St
- 3521 Oleander Ave
- 3525 Mcsherry Way
- 3530 Depassier Way
- 1117 Camino Del Valle
- 1160 Marianas Ln
- 3109 La Campania
- 414 Ironwood Rd
- 3027 Alta Vista
- 1040 Camellia Dr
- 1032 Camellia Dr
- 1037 Holly St
- 1041 Holly St
- 1033 Holly St
- 1044 Camellia Dr
- 1028 Camellia Dr
- 1045 Holly St
- 1029 Holly St
- 1035 Camellia Dr
- 1039 Camellia Dr
- 1048 Camellia Dr
- 1024 Camellia Dr
- 1043 Camellia Dr
- 1027 Camellia Dr
- 1049 Holly St
- 1025 Holly St
- 1023 Camellia Dr
- 1052 Camellia Dr
- 1020 Camellia Dr