1036 Middlesex St Unit 3 Lowell, MA 01851
Lower Highlands NeighborhoodEstimated Value: $209,000 - $267,000
About This Home
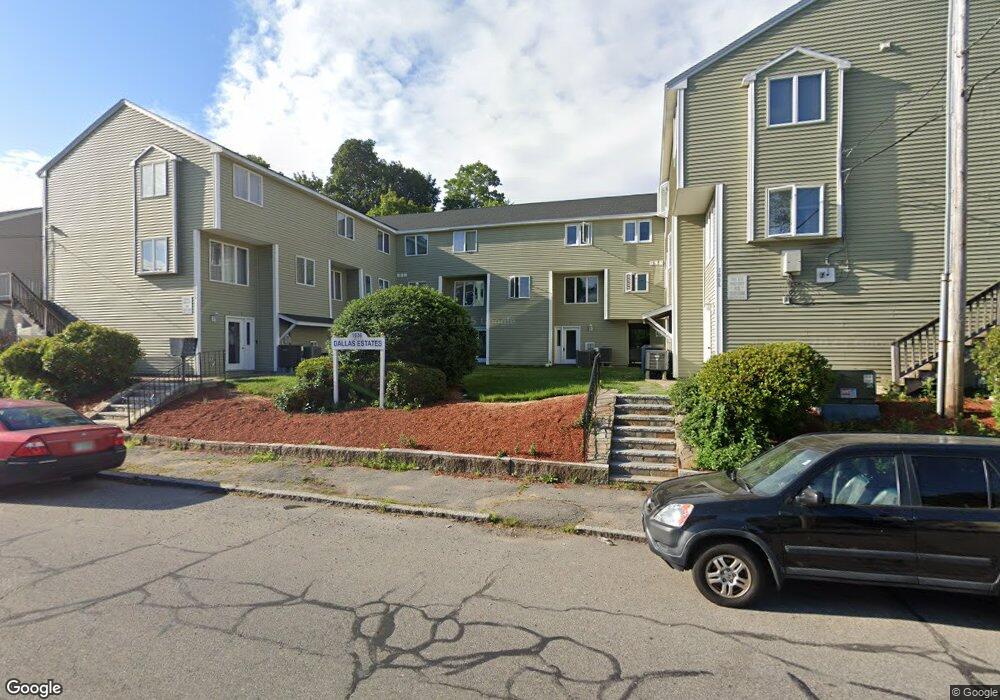
This home is located at 1036 Middlesex St Unit 3, Lowell, MA 01851 and is currently estimated at $241,834, approximately $327 per square foot. 1036 Middlesex St Unit 3 is a home located in Middlesex County with nearby schools including Charles W. Morey Elementary School, Abraham Lincoln Elementary School, and Charlotte M. Murkland Elementary School.
Ownership History
Purchase Details
Home Financials for this Owner
Home Financials are based on the most recent Mortgage that was taken out on this home.Purchase Details
Home Financials for this Owner
Home Financials are based on the most recent Mortgage that was taken out on this home.Purchase Details
Home Financials for this Owner
Home Financials are based on the most recent Mortgage that was taken out on this home.Purchase Details
Home Financials for this Owner
Home Financials are based on the most recent Mortgage that was taken out on this home.Purchase Details
Purchase Details
Home Values in the Area
Average Home Value in this Area
Purchase History
We collect this data history from publicly available records. To have your information removed, we recommend requesting removal directly through your county’s website.
| Date | Buyer | Sale Price | Title Company |
|---|---|---|---|
| Lay Arun P | $52,000 | -- | |
| Lay Anthony | $38,900 | -- | |
| Czaya Richard | $35,000 | -- | |
| Kassin David J | $28,700 | -- | |
| Brady Shane | $21,630 | -- | |
| Fhlmc | $48,300 | -- |
Mortgage History
We collect this data history from publicly available records. To have your information removed, we recommend requesting removal directly through your county’s website.
| Date | Status | Borrower | Loan Amount |
|---|---|---|---|
| Open | Fhlmc | $36,000 | |
| Previous Owner | Fhlmc | $36,955 | |
| Previous Owner | Fhlmc | $29,750 | |
| Previous Owner | Fhlmc | $25,800 |
Tax History
| Year | Tax Paid | Tax Assessment Tax Assessment Total Assessment is a certain percentage of the fair market value that is determined by local assessors to be the total taxable value of land and additions on the property. | Land | Improvement |
|---|---|---|---|---|
| 2025 | $2,135 | $186,000 | $0 | $186,000 |
| 2024 | $2,009 | $168,700 | $0 | $168,700 |
| 2023 | $1,847 | $148,700 | $0 | $148,700 |
| 2022 | $2,117 | $166,800 | $0 | $166,800 |
| 2021 | $1,818 | $135,100 | $0 | $135,100 |
| 2020 | $1,638 | $122,600 | $0 | $122,600 |
| 2019 | $1,386 | $98,700 | $0 | $98,700 |
| 2018 | $1,465 | $101,800 | $0 | $101,800 |
| 2017 | $1,602 | $107,400 | $0 | $107,400 |
| 2016 | $1,436 | $94,700 | $0 | $94,700 |
| 2015 | $1,378 | $89,000 | $0 | $89,000 |
| 2013 | $1,396 | $93,000 | $0 | $93,000 |
Map
- 237 Branch St
- 1045 Middlesex St
- 1036 Middlesex St Unit 9
- 1017 Middlesex St Unit 5
- 312 Wilder St
- 1159 Middlesex St
- 78 Stevens St
- 446 Westford St Unit 1
- 137 Pine St Unit 29
- 255 School St Unit B
- 217 Cross St
- 67 S Loring St
- 54 Gates St Unit 2
- 252 Shaw St
- 710 School St
- 11 W Bowers St Unit 3
- 68 Liberty St
- 627 Westford St
- 122 S Walker St
- 113 School St Unit 12
- 298 Walker St
- 302 Walker St
- 1048 Middlesex St
- 1066 Middlesex St Unit 1
- 1066 Middlesex St
- 225 Branch St
- 1045 Middlesex St Unit B,1045
- 1045 Middlesex St Unit 1st Floor
- 1045 Middlesex St Unit B
- 1036 Middlesex St Unit 1
- 1036 Middlesex St Unit 12
- 1036 Middlesex St Unit 11
- 1036 Middlesex St Unit 10
- 1036 Middlesex St Unit 8
- 1036 Middlesex St Unit 7
- 1036 Middlesex St Unit 6
- 1036 Middlesex St Unit 5
- 1036 Middlesex St Unit 4
- 1036 Middlesex St Unit 2
- 1036 Middlesex St Unit 4,1036
Ask me questions while you tour the home.