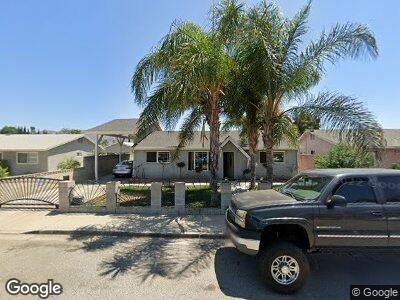
1036 Oliver St Fillmore, CA 93015
Estimated Value: $602,000 - $676,000
3
Beds
2
Baths
1,120
Sq Ft
$558/Sq Ft
Est. Value
About This Home
This home is located at 1036 Oliver St, Fillmore, CA 93015 and is currently estimated at $625,052, approximately $558 per square foot. 1036 Oliver St is a home located in Ventura County with nearby schools including Fillmore Senior High.
Ownership History
Date
Name
Owned For
Owner Type
Purchase Details
Closed on
Jun 28, 2001
Sold by
Silva Luis and Silva Carmen G
Bought by
Magana Damian and Magana Veronica
Current Estimated Value
Home Financials for this Owner
Home Financials are based on the most recent Mortgage that was taken out on this home.
Original Mortgage
$155,000
Interest Rate
7.14%
Mortgage Type
Stand Alone First
Purchase Details
Closed on
May 11, 1998
Sold by
Duran Silvestre
Bought by
Silva Luis and Silva Carmen G
Purchase Details
Closed on
Jan 24, 1997
Sold by
Duran Ofelia
Bought by
Duran Silvestre
Home Financials for this Owner
Home Financials are based on the most recent Mortgage that was taken out on this home.
Original Mortgage
$94,000
Interest Rate
7.74%
Purchase Details
Closed on
Dec 31, 1996
Sold by
Federal National Mortgage Association
Bought by
Silva Luis and Silva Carmen G
Home Financials for this Owner
Home Financials are based on the most recent Mortgage that was taken out on this home.
Original Mortgage
$94,000
Interest Rate
7.74%
Purchase Details
Closed on
Sep 18, 1996
Sold by
Ibarra Jorge R and Ibarra Anita G
Bought by
Federal National Mortgage Association
Create a Home Valuation Report for This Property
The Home Valuation Report is an in-depth analysis detailing your home's value as well as a comparison with similar homes in the area
Home Values in the Area
Average Home Value in this Area
Purchase History
| Date | Buyer | Sale Price | Title Company |
|---|---|---|---|
| Magana Damian | $200,000 | Lawyers Title Company | |
| Silva Luis | -- | -- | |
| Duran Silvestre | -- | Old Republic Title Company | |
| Silva Luis | $117,500 | Old Republic Title Company | |
| Federal National Mortgage Association | $130,000 | Fidelity National Title Ins |
Source: Public Records
Mortgage History
| Date | Status | Borrower | Loan Amount |
|---|---|---|---|
| Open | Magana Damian | $121,000 | |
| Closed | Magana Damian | $155,000 | |
| Previous Owner | Silva Luis | $94,000 | |
| Closed | Magana Damian | $25,000 |
Source: Public Records
Tax History Compared to Growth
Tax History
| Year | Tax Paid | Tax Assessment Tax Assessment Total Assessment is a certain percentage of the fair market value that is determined by local assessors to be the total taxable value of land and additions on the property. | Land | Improvement |
|---|---|---|---|---|
| 2024 | $3,354 | $295,435 | $118,173 | $177,262 |
| 2023 | $3,308 | $289,643 | $115,856 | $173,787 |
| 2022 | $3,060 | $283,964 | $113,584 | $170,380 |
| 2021 | $3,480 | $278,397 | $111,357 | $167,040 |
| 2020 | $3,229 | $275,544 | $110,216 | $165,328 |
| 2019 | $3,238 | $270,142 | $108,055 | $162,087 |
| 2018 | $3,173 | $264,846 | $105,937 | $158,909 |
| 2017 | $3,191 | $259,654 | $103,860 | $155,794 |
| 2016 | $2,955 | $254,564 | $101,824 | $152,740 |
| 2015 | $2,875 | $250,743 | $100,296 | $150,447 |
| 2014 | $2,872 | $245,832 | $98,332 | $147,500 |
Source: Public Records
Map
Nearby Homes
- 300 C St
- 1203 S Sespe St
- 320 D St
- 1144 Oriole Cir
- 461 Old Telegraph Rd
- 803 Sespe Ave
- 734 Balden Ln
- 831 Blaine Ave
- 599 Heritage Valley Pkwy
- 578 Apricot Ln
- 335 Grapefruit Ln
- 571 Heritage Valley Pkwy
- 246 Central Ave
- 340 Central Ave
- 513 Heritage Valley Pkwy
- 937 5th St
- 0 Fillmore St
- 1005 B St
- 359 Edgewood Dr
- 835 Woodgrove Rd
- 1036 Oliver St
- 1030 Oliver St
- 1042 Oliver St
- 1037 Ortega St
- 1048 Oliver St
- 1024 Oliver St
- 1043 Ortega St
- 1031 Ortega St
- 1033 Oliver St
- 1041 Oliver St
- 1047 Ortega St
- 1025 Ortega St
- 1027 Oliver St
- 1052 Oliver St
- 1016 Oliver St
- 1053 Ortega St
- 1017 Oliver St
- 329 Wileman St
- 1019 Ortega St
- 1040 Wileman St