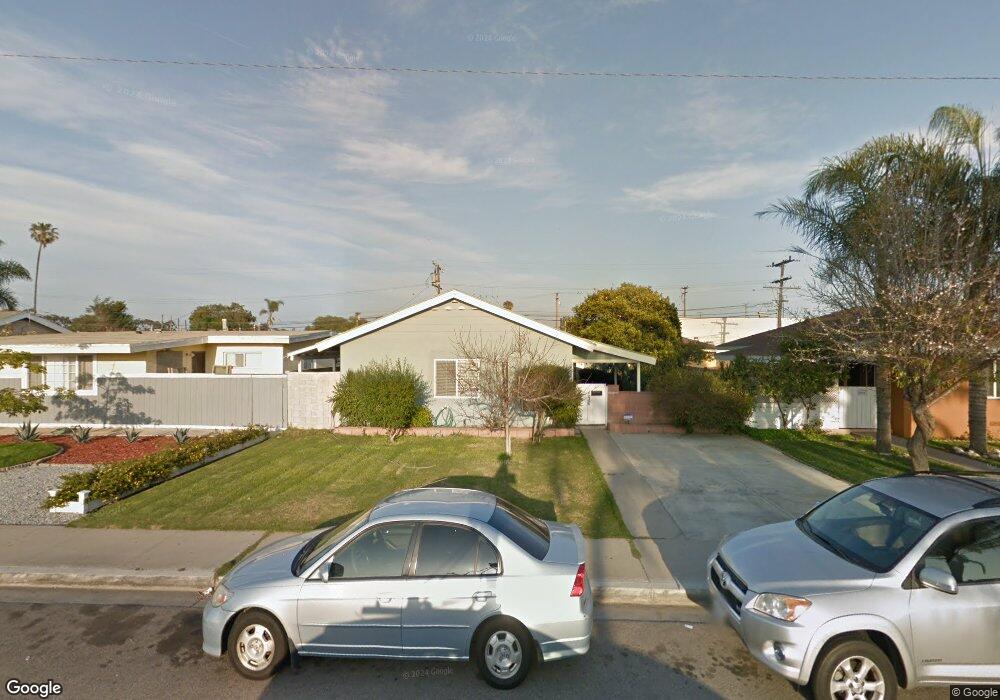
1036 Ontario St Oxnard, CA 93035
Sea Air NeighborhoodEstimated Value: $613,343 - $747,000
3
Beds
1
Bath
988
Sq Ft
$685/Sq Ft
Est. Value
About This Home
This home is located at 1036 Ontario St, Oxnard, CA 93035 and is currently estimated at $676,836, approximately $685 per square foot. 1036 Ontario St is a home located in Ventura County with nearby schools including Juan Lagunas Soria Elementary School, Oxnard High School, and New Harvest Christian School.
Ownership History
Date
Name
Owned For
Owner Type
Purchase Details
Closed on
Jun 22, 2010
Sold by
Moreno Maura R
Bought by
Tapia Jaime and Tapia Estela
Current Estimated Value
Purchase Details
Closed on
Sep 4, 2008
Sold by
Moreno Maura R
Bought by
Moreno Maura R and Tapia Jaime
Purchase Details
Closed on
Dec 6, 2001
Sold by
Magana Guadalupe and Anderson Amy
Bought by
Moreno Cristobal P and Moreno Maura R
Home Financials for this Owner
Home Financials are based on the most recent Mortgage that was taken out on this home.
Original Mortgage
$20,500
Interest Rate
6.39%
Mortgage Type
Credit Line Revolving
Purchase Details
Closed on
Jul 18, 2001
Sold by
Magana Robert Romo
Bought by
Magana Lupe and Waley Rosemarie
Create a Home Valuation Report for This Property
The Home Valuation Report is an in-depth analysis detailing your home's value as well as a comparison with similar homes in the area
Home Values in the Area
Average Home Value in this Area
Purchase History
| Date | Buyer | Sale Price | Title Company |
|---|---|---|---|
| Tapia Jaime | -- | None Available | |
| Moreno Maura R | -- | None Available | |
| Moreno Cristobal P | $205,000 | Chicago Title Co | |
| Magana Lupe | -- | -- |
Source: Public Records
Mortgage History
| Date | Status | Borrower | Loan Amount |
|---|---|---|---|
| Previous Owner | Moreno Cristobal P | $20,500 | |
| Previous Owner | Moreno Cristobal P | $164,000 |
Source: Public Records
Tax History
| Year | Tax Paid | Tax Assessment Tax Assessment Total Assessment is a certain percentage of the fair market value that is determined by local assessors to be the total taxable value of land and additions on the property. | Land | Improvement |
|---|---|---|---|---|
| 2025 | $3,614 | $302,822 | $121,128 | $181,694 |
| 2024 | $3,614 | $296,885 | $118,753 | $178,132 |
| 2023 | $3,481 | $291,064 | $116,424 | $174,640 |
| 2022 | $3,375 | $285,357 | $114,141 | $171,216 |
| 2021 | $3,347 | $279,762 | $111,903 | $167,859 |
| 2020 | $3,408 | $276,895 | $110,756 | $166,139 |
| 2019 | $3,310 | $271,467 | $108,585 | $162,882 |
| 2018 | $3,263 | $266,145 | $106,456 | $159,689 |
| 2017 | $3,096 | $260,927 | $104,369 | $156,558 |
| 2016 | $2,987 | $255,812 | $102,323 | $153,489 |
| 2015 | $3,017 | $251,972 | $100,787 | $151,185 |
| 2014 | $2,982 | $247,037 | $98,813 | $148,224 |
Source: Public Records
Map
Nearby Homes
- 1501 Pisco Ln
- 1309 Nautical Way
- 1174 Oyster Place Unit 15
- 1231 Lost Point Ln
- 807 Kingfisher Way
- 940 Stern Ln
- 2213 Miramar Walk
- 1254 Miramar Walk
- 1030 Ilena St
- 2401 El Portal Way
- 2324 Miramar Walk
- 603 S G St
- 550 S G St
- 257 E Garden Green
- 2900 Windward Way
- 1820 Claremont Dr
- 137 E Garden Green
- 2923 Kelp Ln Unit 11
- 13 W Garden Green
- 1170 Windward Way
- 1044 Ontario St
- 1030 Ontario St
- 1022 Ontario St
- 1054 Ontario St
- 1037 S Ventura Rd
- 1014 Ontario St
- 1035 Ontario St
- 1045 Ontario St
- 1025 Ontario St
- 1055 Ontario St
- 1006 Ontario St
- 1015 Ontario St
- 1003 S Ventura Rd
- 946 Ontario St
- 1005 Ontario St
- 1034 Piedmont St
- 1044 Piedmont St
- 943 S Ventura Rd
- 1024 Piedmont St
- 938 Ontario St
Your Personal Tour Guide
Ask me questions while you tour the home.