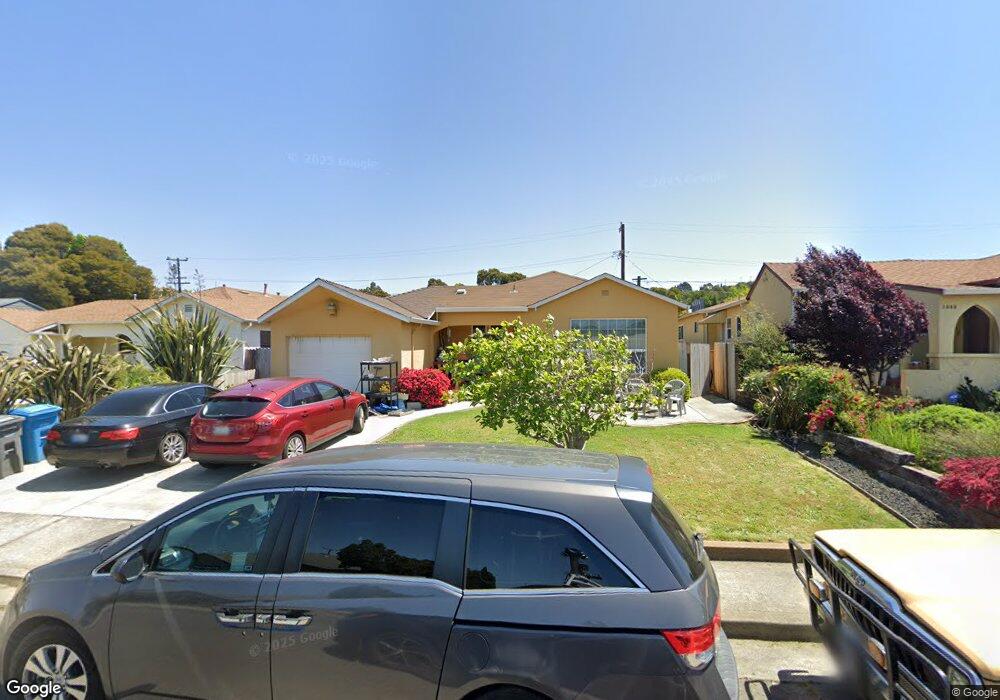
1036 Pine St Vallejo, CA 94590
South Vallejo NeighborhoodEstimated Value: $457,630 - $504,000
3
Beds
1
Bath
1,625
Sq Ft
$294/Sq Ft
Est. Value
About This Home
This home is located at 1036 Pine St, Vallejo, CA 94590 and is currently estimated at $477,908, approximately $294 per square foot. 1036 Pine St is a home located in Solano County with nearby schools including Grace Patterson Elementary School, Vallejo High School, and Mustard Seed Preschool and Kindergarten.
Ownership History
Date
Name
Owned For
Owner Type
Purchase Details
Closed on
Apr 18, 2024
Sold by
Brown Goldye F
Bought by
Goldye Faye Brown Living Trust and Brown
Current Estimated Value
Purchase Details
Closed on
May 21, 2018
Sold by
Brown Oliver S
Bought by
Brown Goldye F
Home Financials for this Owner
Home Financials are based on the most recent Mortgage that was taken out on this home.
Original Mortgage
$221,900
Interest Rate
4.4%
Mortgage Type
New Conventional
Purchase Details
Closed on
Jul 31, 2004
Sold by
Morales Adela H
Bought by
Brown Goldye F and Taylor Juanita W
Home Financials for this Owner
Home Financials are based on the most recent Mortgage that was taken out on this home.
Original Mortgage
$295,960
Interest Rate
6.24%
Mortgage Type
Purchase Money Mortgage
Create a Home Valuation Report for This Property
The Home Valuation Report is an in-depth analysis detailing your home's value as well as a comparison with similar homes in the area
Home Values in the Area
Average Home Value in this Area
Purchase History
| Date | Buyer | Sale Price | Title Company |
|---|---|---|---|
| Goldye Faye Brown Living Trust | -- | None Listed On Document | |
| Brown Goldye F | -- | None Available | |
| Brown Goldye E | -- | None Available | |
| Brown Goldye F | $370,000 | Frontier Title Co |
Source: Public Records
Mortgage History
| Date | Status | Borrower | Loan Amount |
|---|---|---|---|
| Previous Owner | Brown Goldye F | $221,900 | |
| Previous Owner | Brown Goldye F | $295,960 |
Source: Public Records
Tax History
| Year | Tax Paid | Tax Assessment Tax Assessment Total Assessment is a certain percentage of the fair market value that is determined by local assessors to be the total taxable value of land and additions on the property. | Land | Improvement |
|---|---|---|---|---|
| 2025 | $2,703 | $141,986 | $38,721 | $103,265 |
| 2024 | $2,703 | $139,203 | $37,963 | $101,240 |
| 2023 | $2,509 | $136,474 | $37,219 | $99,255 |
| 2022 | $2,402 | $133,799 | $36,490 | $97,309 |
| 2021 | $2,850 | $131,176 | $35,775 | $95,401 |
| 2020 | $2,338 | $129,832 | $35,409 | $94,423 |
| 2019 | $2,249 | $127,287 | $34,715 | $92,572 |
| 2018 | $5,123 | $351,000 | $49,000 | $302,000 |
| 2017 | $4,106 | $296,000 | $44,000 | $252,000 |
| 2016 | $3,606 | $273,000 | $43,000 | $230,000 |
| 2015 | $2,805 | $242,000 | $41,000 | $201,000 |
| 2014 | $2,373 | $203,000 | $35,000 | $168,000 |
Source: Public Records
Map
Nearby Homes
- 1012 Pine St
- 121 Lincoln Rd W
- 942 5th St
- 173 Jordan St
- 246 Jordan St
- 225 Gary Cir
- 816 Grant St
- 199 Sandy Beach Rd
- 105 Laguna St
- 314 San Marcus Dr
- 24 Constance Dr
- 219 Sea Crest Cir
- 97 Del Sur St
- 175 Frieda Cir
- 410 San Gabriel Dr Unit 410
- 15 Constance Dr
- 173 Frieda Cir
- 108 Mesa St
- 469 La Jolla St
- 87 Gloria Ct
Your Personal Tour Guide
Ask me questions while you tour the home.