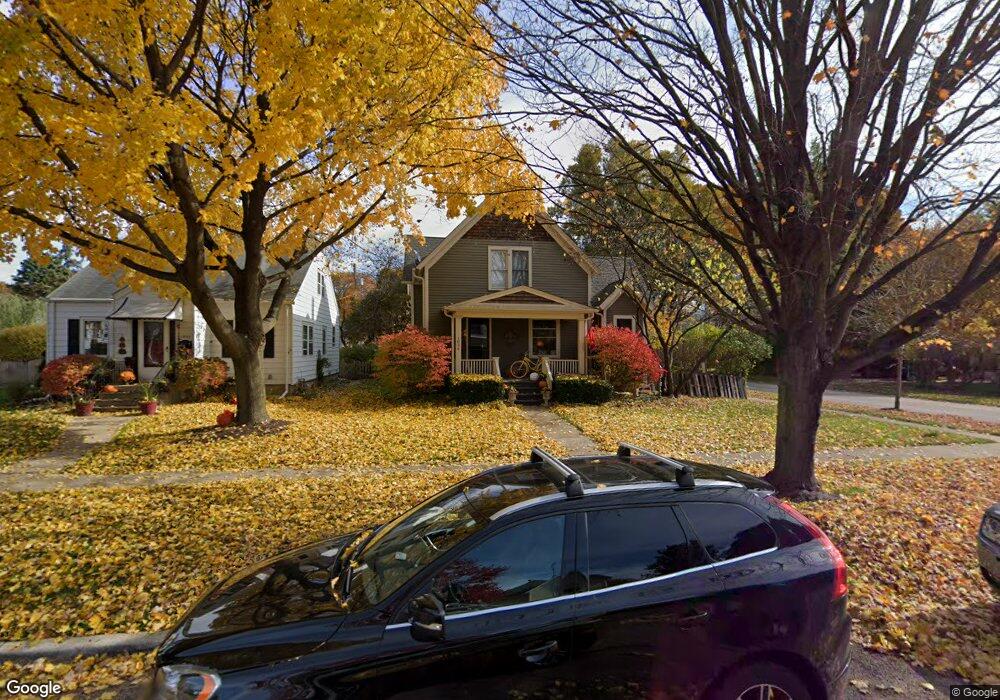
1036 S 2nd St Saint Charles, IL 60174
Southwest Saint Charles NeighborhoodEstimated Value: $470,000 - $625,000
3
Beds
3
Baths
2,855
Sq Ft
$191/Sq Ft
Est. Value
About This Home
This home is located at 1036 S 2nd St, Saint Charles, IL 60174 and is currently estimated at $545,137, approximately $190 per square foot. 1036 S 2nd St is a home located in Kane County with nearby schools including Davis Primary School, Richmond Intermediate School, and Thompson Middle School.
Ownership History
Date
Name
Owned For
Owner Type
Purchase Details
Closed on
May 21, 2024
Sold by
Kresl Thomas A and Kresl Melissa
Bought by
Thomas And Melissa Kresl Living Trust and Kresl
Current Estimated Value
Purchase Details
Closed on
Apr 29, 1999
Sold by
Shelton Timothy G and Shelton Jane S
Bought by
Kresl Thomas and Kresl Melissa
Home Financials for this Owner
Home Financials are based on the most recent Mortgage that was taken out on this home.
Original Mortgage
$133,000
Interest Rate
7.04%
Create a Home Valuation Report for This Property
The Home Valuation Report is an in-depth analysis detailing your home's value as well as a comparison with similar homes in the area
Home Values in the Area
Average Home Value in this Area
Purchase History
| Date | Buyer | Sale Price | Title Company |
|---|---|---|---|
| Thomas And Melissa Kresl Living Trust | -- | Chicago Title Insurance Compan | |
| Kresl Thomas | $173,500 | -- |
Source: Public Records
Mortgage History
| Date | Status | Borrower | Loan Amount |
|---|---|---|---|
| Previous Owner | Kresl Thomas | $133,000 |
Source: Public Records
Tax History Compared to Growth
Tax History
| Year | Tax Paid | Tax Assessment Tax Assessment Total Assessment is a certain percentage of the fair market value that is determined by local assessors to be the total taxable value of land and additions on the property. | Land | Improvement |
|---|---|---|---|---|
| 2024 | $11,034 | $156,641 | $32,398 | $124,243 |
| 2023 | $10,580 | $140,196 | $28,997 | $111,199 |
| 2022 | $10,264 | $133,120 | $28,406 | $104,714 |
| 2021 | $9,860 | $126,890 | $27,077 | $99,813 |
| 2020 | $9,755 | $124,524 | $26,572 | $97,952 |
| 2019 | $9,579 | $122,059 | $26,046 | $96,013 |
| 2018 | $9,211 | $117,053 | $23,429 | $93,624 |
| 2017 | $8,970 | $113,051 | $22,628 | $90,423 |
| 2016 | $9,417 | $109,080 | $21,833 | $87,247 |
| 2015 | -- | $102,223 | $21,598 | $80,625 |
| 2014 | -- | $96,044 | $21,598 | $74,446 |
| 2013 | -- | $97,314 | $21,814 | $75,500 |
Source: Public Records
Map
Nearby Homes
- 1008 Pine St
- 1028 S 5th St
- 885 Geneva Rd
- Lot 1 Keller Place
- Lot 2 Geneva Rd
- Lot 1 Geneva Rd
- 1017 S 6th St
- 82 Gray St
- 629 N Lincoln Ave
- 806 Fellows St
- 311 Ohio Ave
- 50 S 1st St Unit 5D
- 1108 S 12th St Unit 2
- 839 N Bennett St
- 2749 Stone Cir
- 2753 Stone Cir
- 2747 Stone Cir
- 2751 Stone Cir
- 1330-1332 S 14th St
- 602 Highbury Ln