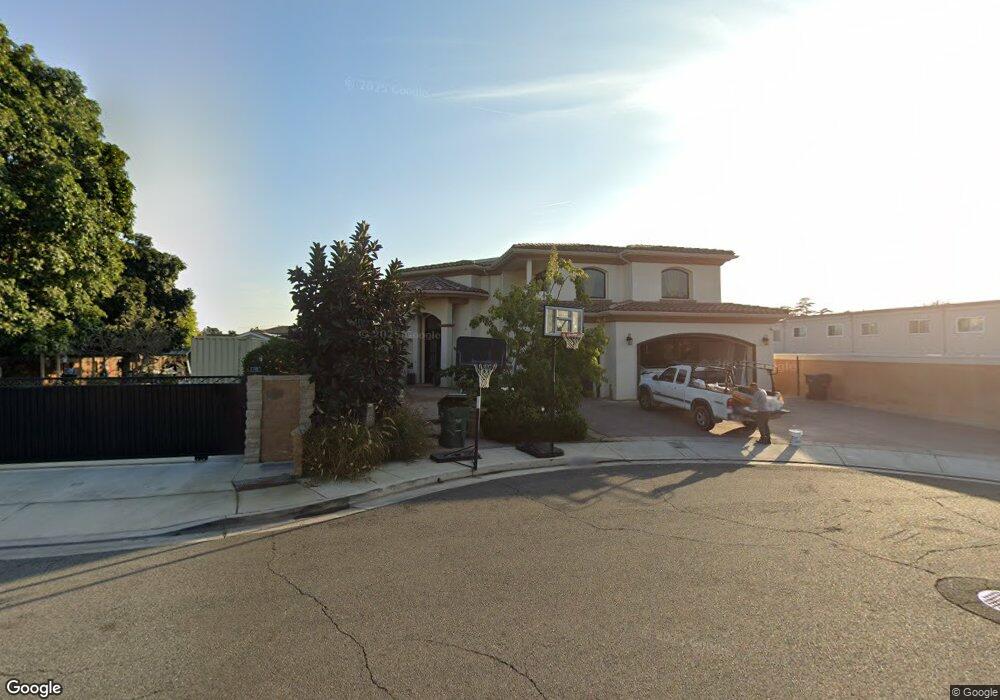
10362 Circulo de Villa Fountain Valley, CA 92708
Estimated Value: $2,235,000 - $3,909,686
7
Beds
9
Baths
7,200
Sq Ft
$408/Sq Ft
Est. Value
About This Home
This home is located at 10362 Circulo de Villa, Fountain Valley, CA 92708 and is currently estimated at $2,938,229, approximately $408 per square foot. 10362 Circulo de Villa is a home located in Orange County with nearby schools including Cox (James H.) Elementary School, Masuda (Kazuo) Middle School, and Fountain Valley High School.
Ownership History
Date
Name
Owned For
Owner Type
Purchase Details
Closed on
Aug 4, 2025
Sold by
Bazola Llc
Bought by
Tran Bang H
Current Estimated Value
Purchase Details
Closed on
Nov 14, 2019
Sold by
Tran Bang H
Bought by
Bazola Llc
Purchase Details
Closed on
Mar 11, 2014
Sold by
Avalos Carolyn Marie and Banuelos Linda S
Bought by
Tran Bang H
Purchase Details
Closed on
Jun 23, 2006
Sold by
Avalos Carolyn Marie
Bought by
Avalos Carolyn Marie
Purchase Details
Closed on
Jul 23, 2001
Sold by
Banuelos Linda Susan
Bought by
Banuelos Linda S and Bradley Terry L
Purchase Details
Closed on
Jan 31, 1996
Sold by
Banuelos John
Bought by
Banuelos John C
Purchase Details
Closed on
Aug 18, 1993
Sold by
Banuelos Jerry
Bought by
Banuelos Jerry C and Banuelos Wahleah F
Create a Home Valuation Report for This Property
The Home Valuation Report is an in-depth analysis detailing your home's value as well as a comparison with similar homes in the area
Home Values in the Area
Average Home Value in this Area
Purchase History
| Date | Buyer | Sale Price | Title Company |
|---|---|---|---|
| Tran Bang H | -- | None Listed On Document | |
| Bazola Llc | -- | None Available | |
| Tran Bang H | $980,000 | Wfg Title Company Of Ca | |
| Avalos Carolyn Marie | -- | None Available | |
| Banuelos Linda S | -- | -- | |
| Banuelos John C | -- | -- | |
| Banuelos Jerry C | -- | -- |
Source: Public Records
Tax History Compared to Growth
Tax History
| Year | Tax Paid | Tax Assessment Tax Assessment Total Assessment is a certain percentage of the fair market value that is determined by local assessors to be the total taxable value of land and additions on the property. | Land | Improvement |
|---|---|---|---|---|
| 2025 | $30,653 | $2,864,007 | $1,177,788 | $1,686,219 |
| 2024 | $30,653 | $2,807,850 | $1,154,694 | $1,653,156 |
| 2023 | $29,950 | $2,752,795 | $1,132,053 | $1,620,742 |
| 2022 | $29,537 | $2,698,819 | $1,109,856 | $1,588,963 |
| 2021 | $28,961 | $2,645,901 | $1,088,094 | $1,557,807 |
| 2020 | $28,800 | $2,618,771 | $1,076,937 | $1,541,834 |
| 2019 | $28,743 | $2,618,771 | $1,076,937 | $1,541,834 |
| 2018 | $27,366 | $2,491,838 | $1,055,821 | $1,436,017 |
| 2017 | $25,934 | $2,351,232 | $1,035,119 | $1,316,113 |
| 2016 | $21,463 | $2,022,917 | $1,014,823 | $1,008,094 |
| 2015 | $10,609 | $999,580 | $999,580 | $0 |
| 2014 | $323 | $29,254 | $29,254 | $0 |
Source: Public Records
Map
Nearby Homes
- 17071 Ward St
- 10322 Avenida Cinco de Mayo
- 10452 Circulo de Juarez
- 17077 Los Modelos St
- 17333 Brookhurst St Unit C9
- 17333 Brookhurst St Unit B7
- 17333 Brookhurst St Unit D6
- 10519 La Rosa Cir
- 17288 San Lorenzo Cir
- 17230 San Lorenzo Cir
- 17413 Siena Ln
- 10430 La Cebra Ave
- 17401 Hood Ct
- 16767 Madrone Cir
- 10900 La Flor Ave
- 16379 Shadbush St
- 17215 Buttonwood St
- 16806 Olive St
- 9446 Gardenia Ave
- 11356 Stonecress Ave
- 10361 Calle Madero
- 10371 Calle Madero
- 10381 Calle Madero
- 10382 Circulo de Villa
- 10391 Calle Madero
- 10391 Calle Madero
- 17040 San Bruno St
- 17040 San Bruno St Unit D9&D21
- 17040 San Bruno St Unit 7
- 17040 San Bruno St Unit 2
- 17040 San Bruno St Unit 1
- 17040 San Bruno St Unit 10
- 17040 San Bruno St Unit 12
- 17040 San Bruno St Unit 3
- 17040 San Bruno St Unit 11
- 17040 San Bruno St Unit 9
- 17040 San Bruno St Unit 8
- 17040 San Bruno St Unit 6
- 17040 San Bruno St Unit 5
- 17040 San Bruno St Unit 4