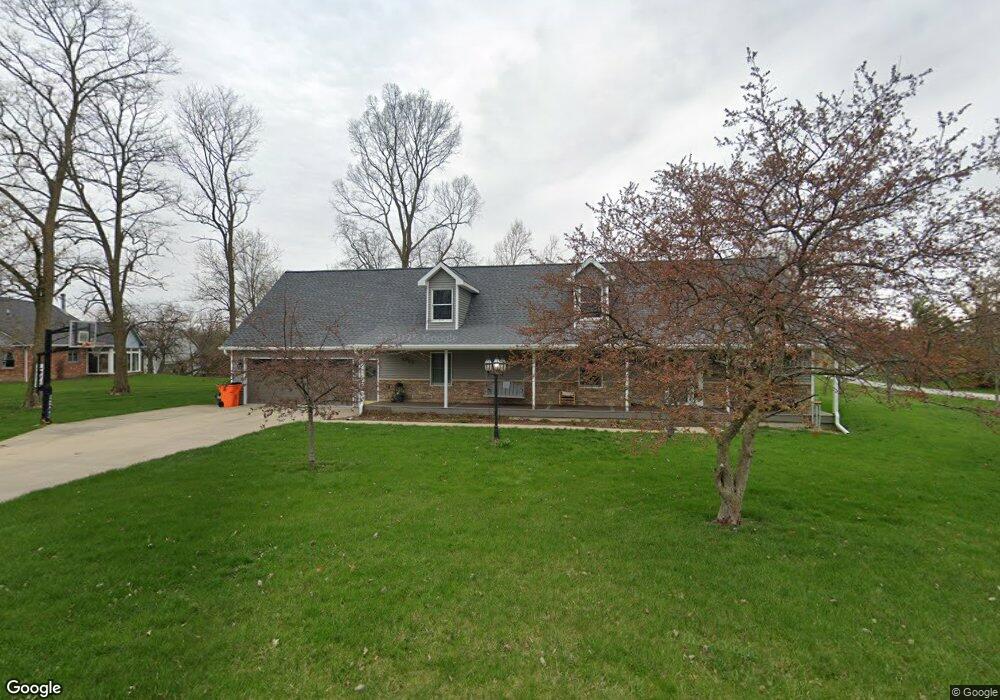
10366 E 155 S Greentown, IN 46936
Estimated Value: $222,000 - $454,000
5
Beds
2
Baths
3,596
Sq Ft
$80/Sq Ft
Est. Value
About This Home
This home is located at 10366 E 155 S, Greentown, IN 46936 and is currently estimated at $288,124, approximately $80 per square foot. 10366 E 155 S is a home located in Howard County with nearby schools including Eastern Elementary School and Eastern High School.
Ownership History
Date
Name
Owned For
Owner Type
Purchase Details
Closed on
Jun 12, 2023
Sold by
Vanmatre John V
Bought by
Vanmatre John V and Vanmatre Van Matre
Current Estimated Value
Purchase Details
Closed on
Jun 9, 2023
Sold by
Vanmatre John V
Bought by
Vanmatre John V and Vanmatre Van Matre
Purchase Details
Closed on
Oct 24, 2019
Sold by
Sovern Sherry L
Bought by
Vanmatre John V
Home Financials for this Owner
Home Financials are based on the most recent Mortgage that was taken out on this home.
Original Mortgage
$95,000
Interest Rate
3.5%
Mortgage Type
New Conventional
Purchase Details
Closed on
Oct 23, 2019
Sold by
Vanmatre Sherry L and Sovern Sherry L
Bought by
Vanmatre John V
Home Financials for this Owner
Home Financials are based on the most recent Mortgage that was taken out on this home.
Original Mortgage
$95,000
Interest Rate
3.5%
Mortgage Type
New Conventional
Create a Home Valuation Report for This Property
The Home Valuation Report is an in-depth analysis detailing your home's value as well as a comparison with similar homes in the area
Home Values in the Area
Average Home Value in this Area
Purchase History
| Date | Buyer | Sale Price | Title Company |
|---|---|---|---|
| Vanmatre John V | -- | None Listed On Document | |
| Vanmatre John V | -- | None Listed On Document | |
| Vanmatre John V | $126,350 | Metropolitan Title | |
| Vanmatre John V | -- | Metropolitan Title |
Source: Public Records
Mortgage History
| Date | Status | Borrower | Loan Amount |
|---|---|---|---|
| Previous Owner | Vanmatre John V | $95,000 | |
| Previous Owner | Vanmatre John V | $95,000 |
Source: Public Records
Tax History Compared to Growth
Tax History
| Year | Tax Paid | Tax Assessment Tax Assessment Total Assessment is a certain percentage of the fair market value that is determined by local assessors to be the total taxable value of land and additions on the property. | Land | Improvement |
|---|---|---|---|---|
| 2024 | $1,109 | $147,400 | $15,700 | $131,700 |
| 2022 | $1,119 | $141,300 | $15,700 | $125,600 |
| 2021 | $1,017 | $134,500 | $13,700 | $120,800 |
| 2020 | $950 | $134,500 | $13,700 | $120,800 |
| 2019 | $814 | $126,900 | $13,700 | $113,200 |
| 2018 | $865 | $126,900 | $13,700 | $113,200 |
| 2017 | $895 | $128,000 | $18,300 | $109,700 |
| 2016 | $861 | $128,000 | $18,300 | $109,700 |
| 2014 | $866 | $133,400 | $18,300 | $115,100 |
| 2013 | $897 | $134,500 | $18,300 | $116,200 |
Source: Public Records
Map
Nearby Homes
- 71 S 1100 E
- 1009 Eastcrest Dr
- 1125 Robin Ct
- 8937 E 300 S
- 524 E Grant St
- 312 S Meridian St
- 228 N Indiana St
- 228 E Railroad St
- 204 E Blaine St
- 329 W Grant St
- 405 N Green St
- 9391 E 100 N
- 128 W High St
- 608 W Main St
- 408 W Payton St
- 8898,8924,8948 E 100 N
- 7810 E 50 N
- 36 Timberly Dr
- 3893 E 650 N
- 9502 W 800 S