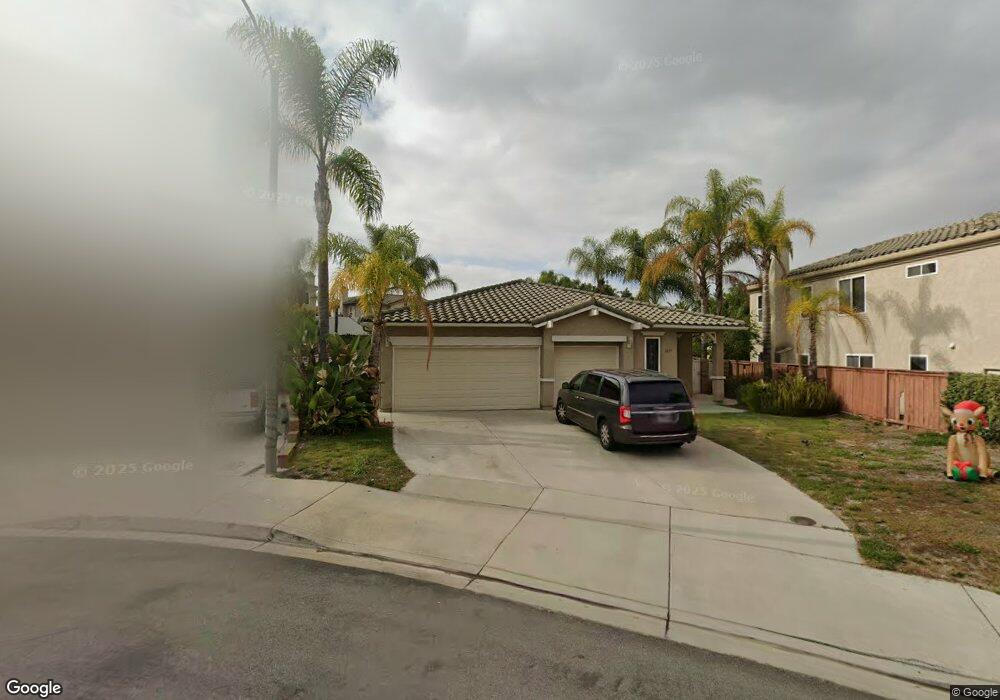
1037 Dorado Way Chula Vista, CA 91910
Rancho Del Rey NeighborhoodEstimated Value: $995,864 - $1,166,000
3
Beds
3
Baths
2,217
Sq Ft
$492/Sq Ft
Est. Value
About This Home
This home is located at 1037 Dorado Way, Chula Vista, CA 91910 and is currently estimated at $1,090,466, approximately $491 per square foot. 1037 Dorado Way is a home located in San Diego County with nearby schools including Casillas Elementary School, Rancho Del Rey Middle School, and Otay Ranch Senior High School.
Ownership History
Date
Name
Owned For
Owner Type
Purchase Details
Closed on
Apr 1, 2015
Sold by
Harner Stephen M and Harner Annie L
Bought by
Harner Family Trust and Harner Annie L
Current Estimated Value
Purchase Details
Closed on
Oct 18, 2010
Sold by
Prudential Relocation Inc
Bought by
Harner Stephen M and Harner Annie L
Purchase Details
Closed on
Oct 15, 2010
Sold by
Ching Wallie C C and Ching Jennifer L
Bought by
Prudential Relocation Inc
Purchase Details
Closed on
Jan 25, 1999
Sold by
Shea Homes Inc
Bought by
Ching Wallie C C and Ching Jennifer L
Home Financials for this Owner
Home Financials are based on the most recent Mortgage that was taken out on this home.
Original Mortgage
$224,150
Interest Rate
6.92%
Create a Home Valuation Report for This Property
The Home Valuation Report is an in-depth analysis detailing your home's value as well as a comparison with similar homes in the area
Home Values in the Area
Average Home Value in this Area
Purchase History
| Date | Buyer | Sale Price | Title Company |
|---|---|---|---|
| Harner Family Trust | -- | None Available | |
| Harner Stephen M | $456,000 | Fidelity National Title San | |
| Prudential Relocation Inc | $456,000 | Fidelity National Title San | |
| Ching Wallie C C | $280,500 | First American Title |
Source: Public Records
Mortgage History
| Date | Status | Borrower | Loan Amount |
|---|---|---|---|
| Previous Owner | Ching Wallie C C | $224,150 |
Source: Public Records
Tax History Compared to Growth
Tax History
| Year | Tax Paid | Tax Assessment Tax Assessment Total Assessment is a certain percentage of the fair market value that is determined by local assessors to be the total taxable value of land and additions on the property. | Land | Improvement |
|---|---|---|---|---|
| 2025 | $6,915 | $584,203 | $212,334 | $371,869 |
| 2024 | $6,915 | $572,749 | $208,171 | $364,578 |
| 2023 | $8,399 | $561,520 | $204,090 | $357,430 |
| 2022 | $8,125 | $550,511 | $200,089 | $350,422 |
| 2021 | $7,927 | $539,717 | $196,166 | $343,551 |
| 2020 | $7,729 | $534,184 | $194,155 | $340,029 |
| 2019 | $7,529 | $523,711 | $190,349 | $333,362 |
| 2018 | $7,392 | $513,443 | $186,617 | $326,826 |
| 2017 | $7,258 | $503,376 | $182,958 | $320,418 |
| 2016 | $7,048 | $493,507 | $179,371 | $314,136 |
| 2015 | $6,938 | $486,095 | $176,677 | $309,418 |
| 2014 | -- | $476,574 | $173,217 | $303,357 |
Source: Public Records
Map
Nearby Homes
- 1057 Paseo Del Norte
- 1060 Via Sinuoso
- 1029 Vista Oak Place
- 1112 Camino Del Rey
- 820 Chervil Ct
- 1181 De Soto Ct Unit 54
- 1175 Santa Olivia Rd
- 1236 El Cortez Ct
- 1270 El Cortez Ct Unit 213
- 1337 Santa Olivia Rd
- 1079 Las Rosas Ct
- 843 Calle Ciela Vista Unit 20
- 728 Cardona Ave
- 1209 Morgan Hill Dr
- 713 Esla Dr
- 1002 Cholla Place
- 1340 Monte Sereno Ave
- 1156 Tristan River Rd
- 1402 Antioch Ave
- 1386 Serena Cir Unit 2
- 1033 Dorado Way
- 1041 Dorado Way
- 1029 E J St
- 1033 E J St Unit 1
- 1045 Dorado Way
- 1025 E J St
- 1037 E J St Unit 1
- 1026 Dorado Ct
- 1032 Dorado Ct
- 1020 Dorado Ct
- 1041 E J St
- 1021 E J St
- 1038 Dorado Ct
- 1042 Dorado Way
- 1049 Dorado Way
- 1038 Dorado Way
- 1045 E J St
- 1034 Dorado Way
- 1030 Dorado Way
- 1053 Dorado Way